Regulatory Compliance Jobs in London

Regulatory Compliance
England > London

The table below provides summary statistics for permanent job vacancies advertised in London requiring Regulatory Compliance skills. It includes a benchmarking guide to the annual salaries offered in vacancies that cited Regulatory Compliance over the 6 months leading up to 10 June 2025, comparing them to the same period in the previous two years.

6 months to
10 Jun 2025
Same period 2024 Same period 2023
Rank 189 443 490
Rank change year-on-year +254 +47 +49
Permanent jobs citing Regulatory Compliance 244 88 106
As % of all permanent jobs advertised in London 1.90% 0.36% 0.34%
As % of the Processes & Methodologies category 1.98% 0.40% 0.35%
Number of salaries quoted 184 64 73
10th Percentile £60,000 £45,705 £46,250
25th Percentile £68,438 £62,500 £63,750
Median annual salary (50th Percentile) £95,000 £72,500 £87,500
Median % change year-on-year +31.03% -17.14% +24.56%
75th Percentile £122,500 £98,750 £115,000
90th Percentile £160,000 £116,875 £135,305
England median annual salary £82,500 £65,000 £70,000
% change year-on-year +26.92% -7.14% +16.67%

All Process and Methodology Skills
London

Regulatory Compliance falls under the Processes and Methodologies category. For comparison with the information above, the following table provides summary statistics for all permanent job vacancies requiring process or methodology skills in London.

Permanent vacancies with a requirement for process or methodology skills 12,341 21,954 29,884
As % of all permanent jobs advertised in London 96.07% 89.57% 95.13%
Number of salaries quoted 6,953 15,939 21,954
10th Percentile £41,250 £37,500 £42,500
25th Percentile £55,000 £51,250 £55,000
Median annual salary (50th Percentile) £75,000 £70,000 £75,000
Median % change year-on-year +7.14% -6.67% +7.14%
75th Percentile £100,000 £95,000 £95,000
90th Percentile £123,700 £115,000 £116,250
England median annual salary £57,500 £55,000 £62,500
% change year-on-year +4.55% -12.00% +4.17%

Regulatory Compliance
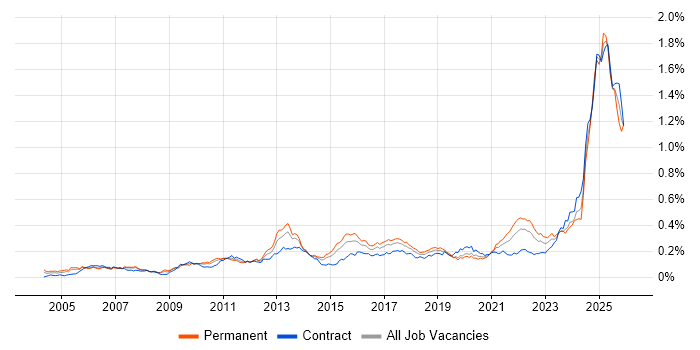
Job Vacancy Trend in London

Job postings citing Regulatory Compliance as a proportion of all IT jobs advertised in London.

Job vacancy trend for Regulatory Compliance in London

Regulatory Compliance
Salary Trend in London

3-month moving average salary quoted in jobs citing Regulatory Compliance in London.

Salary trend for Regulatory Compliance in London

Regulatory Compliance
Salary Histogram in London

Salary distribution for jobs citing Regulatory Compliance in London over the 6 months to 10 June 2025.

Salary histogram for Regulatory Compliance in London

Regulatory Compliance
Job Locations in London

The table below looks at the demand and provides a guide to the median salaries quoted in IT jobs citing Regulatory Compliance within the London region over the 6 months to 10 June 2025. The 'Rank Change' column provides an indication of the change in demand within each location based on the same 6 month period last year.

Location Rank Change
on Same Period
Last Year
Matching
Permanent
IT Job Ads
Median Salary
Past 6 Months
Median Salary
% Change
on Same Period
Last Year
Live
Jobs
Central London +32 29 £90,000 +24.14% 16
East London -14 4 £115,000 +70.37% 1
South London +3 3 £75,000 -11.76% 1
Regulatory Compliance
England

Regulatory Compliance
Co-occurring Skills and Capabilities in London by Category

The follow tables expand on the table above by listing co-occurrences grouped by category. The same employment type, locality and period is covered with up to 20 co-occurrences shown in each of the following categories:

Application Platforms
1 7 (2.87%) Apache Spark
2 5 (2.05%) CMS
2 5 (2.05%) SharePoint
3 4 (1.64%) Confluence
4 1 (0.41%) JBoss
4 1 (0.41%) SAS
Applications
1 4 (1.64%) Microsoft Excel
1 4 (1.64%) Microsoft PowerPoint
2 2 (0.82%) MS Visio
3 1 (0.41%) Adobe Creative Suite
3 1 (0.41%) Chatbot
3 1 (0.41%) Microsoft Project
Business Applications
1 5 (2.05%) Aladdin
2 3 (1.23%) Dynamics CRM
2 3 (1.23%) Relativity
3 1 (0.41%) Adaptiv
3 1 (0.41%) NetSuite
3 1 (0.41%) SAP MM
3 1 (0.41%) SAP PLM
3 1 (0.41%) SAP S/4HANA
Cloud Services
1 52 (21.31%) Azure
2 31 (12.70%) AWS
3 18 (7.38%) Azure DevOps
4 15 (6.15%) Power Platform
4 15 (6.15%) Serverless
5 14 (5.74%) AWS CloudFormation
5 14 (5.74%) PaaS
6 13 (5.33%) AWS Lambda
6 13 (5.33%) GitHub
7 12 (4.92%) GitHub Actions
8 11 (4.51%) GCP
9 10 (4.10%) AWS KMS
10 8 (3.28%) Azure Sentinel
11 7 (2.87%) SaaS
12 6 (2.46%) Azure Synapse Analytics
12 6 (2.46%) Power Automate
13 5 (2.05%) Azure ExpressRoute
13 5 (2.05%) Microsoft 365
14 4 (1.64%) Cloud Computing
14 4 (1.64%) Dynamics 365
Communications & Networking
1 19 (7.79%) Network Security
2 12 (4.92%) VPN
3 10 (4.10%) Firewall
4 3 (1.23%) Intrusion Detection
5 2 (0.82%) Intranet
6 1 (0.41%) DKIM
6 1 (0.41%) DMARC
6 1 (0.41%) Ethernet
6 1 (0.41%) LAN
6 1 (0.41%) Modbus
6 1 (0.41%) SWIFTNet
6 1 (0.41%) TCP/IP
6 1 (0.41%) WAN
6 1 (0.41%) Wireless
Database & Business Intelligence
1 71 (29.10%) Data Lake
2 15 (6.15%) Power BI
3 10 (4.10%) Data Warehouse
4 7 (2.87%) Amazon Redshift
4 7 (2.87%) Big Data
4 7 (2.87%) Metadata
4 7 (2.87%) NoSQL
5 6 (2.46%) BigQuery
5 6 (2.46%) Hadoop
5 6 (2.46%) Relational Database
6 3 (1.23%) EDRMS
7 2 (0.82%) DynamoDB
7 2 (0.82%) MongoDB
7 2 (0.82%) Spark SQL
7 2 (0.82%) Tableau
8 1 (0.41%) Amazon Athena
8 1 (0.41%) Base SAS
8 1 (0.41%) EDMS
8 1 (0.41%) Presto
8 1 (0.41%) SAS Enterprise Guide
Development Applications
1 3 (1.23%) JIRA
2 2 (0.82%) Jenkins
3 1 (0.41%) Git
3 1 (0.41%) Octopus Deploy
3 1 (0.41%) Visual Studio
General
1 143 (58.61%) Finance
2 92 (37.70%) Social Skills
3 80 (32.79%) Front Office
4 43 (17.62%) Analytical Skills
5 25 (10.25%) Banking
6 22 (9.02%) Legal
7 14 (5.74%) Law
8 11 (4.51%) Financial Institution
8 11 (4.51%) Organisational Skills
9 10 (4.10%) Marketing
10 8 (3.28%) Presentation Skills
11 5 (2.05%) Advertising
12 4 (1.64%) Investment Banking
12 4 (1.64%) Manufacturing
12 4 (1.64%) Retail
13 3 (1.23%) Influencing Skills
14 2 (0.82%) Documentation Skills
14 2 (0.82%) French Language
14 2 (0.82%) Italian Language
14 2 (0.82%) Polish Language
Job Titles
1 51 (20.90%) Lead
2 28 (11.48%) Head of Finance
2 28 (11.48%) Senior
3 27 (11.07%) Consultant
4 22 (9.02%) Security Consultant
5 21 (8.61%) Cybersecurity Consultant
5 21 (8.61%) Managing Consultant
6 20 (8.20%) Architect
7 17 (6.97%) Analyst
7 17 (6.97%) Head of Data Management
8 15 (6.15%) Finance Manager
9 14 (5.74%) Data Governance Analyst
9 14 (5.74%) Data Governance Manager
9 14 (5.74%) Governance Manager
9 14 (5.74%) Programme Manager
10 13 (5.33%) Cloud Architect
11 10 (4.10%) AWS Architect
12 9 (3.69%) Azure Engineer
12 9 (3.69%) Developer
13 8 (3.28%) Security Analyst
Libraries, Frameworks & Software Standards
1 19 (7.79%) Kafka
2 12 (4.92%) .NET
2 12 (4.92%) Elastic Stack
3 4 (1.64%) CSS
4 3 (1.23%) ASP.NET
4 3 (1.23%) HTML
5 2 (0.82%) XBRL
6 1 (0.41%) .NET Core
6 1 (0.41%) .NET Framework
6 1 (0.41%) Entity Framework
6 1 (0.41%) FIX Protocol
6 1 (0.41%) GraphQL
6 1 (0.41%) Middleware
6 1 (0.41%) NumPy
6 1 (0.41%) OpenID
6 1 (0.41%) RESTful
6 1 (0.41%) SciPy
6 1 (0.41%) Spring
6 1 (0.41%) Visualforce
6 1 (0.41%) WPF
Miscellaneous
1 72 (29.51%) Derivative
2 71 (29.10%) Hedge funds
3 69 (28.28%) Equities
3 69 (28.28%) Fixed Income
3 69 (28.28%) Foreign Exchange (FX)
4 27 (11.07%) Management Information System
5 22 (9.02%) Life Science
6 16 (6.56%) Security Posture
7 8 (3.28%) Product Ownership
8 7 (2.87%) Market Risk
9 6 (2.46%) Cloud Native
9 6 (2.46%) Data Structures
9 6 (2.46%) FMCG
9 6 (2.46%) Onboarding
10 4 (1.64%) Legacy Systems
11 3 (1.23%) Blockchain
11 3 (1.23%) Cyber Threat
11 3 (1.23%) Greenfield Project
12 2 (0.82%) Hybrid Cloud
12 2 (0.82%) Legacy Applications
Operating Systems
1 10 (4.10%) Linux
2 6 (2.46%) Red Hat Enterprise Linux
2 6 (2.46%) Windows
3 2 (0.82%) VMS
4 1 (0.41%) Unix
4 1 (0.41%) Windows Server
Processes & Methodologies
1 92 (37.70%) Agile
1 92 (37.70%) Data Governance
2 87 (35.66%) Roadmaps
3 85 (34.84%) Data Management
4 82 (33.61%) Migration
5 69 (28.28%) Investment Management
6 48 (19.67%) Problem-Solving
7 41 (16.80%) Analytics
7 41 (16.80%) DevOps
7 41 (16.80%) Risk Management
7 41 (16.80%) Stakeholder Engagement
8 40 (16.39%) CI/CD
8 40 (16.39%) Cybersecurity
9 32 (13.11%) Decision-Making
10 31 (12.70%) Computer Science
11 30 (12.30%) Continuous Improvement
12 29 (11.89%) Business Development
13 27 (11.07%) Mentoring
14 25 (10.25%) Information Security
15 23 (9.43%) Artificial Intelligence
Programming Languages
1 21 (8.61%) SQL
2 19 (7.79%) Java
3 10 (4.10%) Python
4 4 (1.64%) C#
5 3 (1.23%) Bicep
5 3 (1.23%) JavaScript
6 2 (0.82%) R
7 1 (0.41%) Apex Code
7 1 (0.41%) Kotlin
7 1 (0.41%) MATLAB
7 1 (0.41%) PL/SQL
7 1 (0.41%) PowerShell
7 1 (0.41%) Shell Script
Qualifications
1 40 (16.39%) Degree
2 29 (11.89%) CISSP
3 24 (9.84%) CISM
4 20 (8.20%) Computer Science Degree
5 13 (5.33%) AWS Certification
5 13 (5.33%) AWS Certified Solutions Architect
6 12 (4.92%) SC Cleared
6 12 (4.92%) Security Cleared
7 10 (4.10%) PMI Certification
7 10 (4.10%) PMP
8 8 (3.28%) Master's Degree
9 7 (2.87%) CFA
10 6 (2.46%) PhD
11 4 (1.64%) ITIL Certification
11 4 (1.64%) Numerate Degree
12 3 (1.23%) Azure Certification
12 3 (1.23%) CISA
12 3 (1.23%) Cisco Certification
12 3 (1.23%) ISO 27001 Lead Auditor
12 3 (1.23%) TOGAF Certification
Quality Assurance & Compliance
1 43 (17.62%) GDPR
2 29 (11.89%) MiFID
3 27 (11.07%) ISO/IEC 27001
4 19 (7.79%) HIPAA
4 19 (7.79%) NIST
5 15 (6.15%) Data Quality
6 5 (2.05%) Sarbanes-Oxley
7 4 (1.64%) Accessibility
7 4 (1.64%) Cyber Essentials
7 4 (1.64%) Cyber Essentials PLUS
7 4 (1.64%) SOC 2
8 3 (1.23%) PCI DSS
8 3 (1.23%) QA
9 2 (0.82%) Basel III
9 2 (0.82%) COBIT
9 2 (0.82%) Good Clinical Practice
9 2 (0.82%) GRC
9 2 (0.82%) NIST 800
9 2 (0.82%) SLA
10 1 (0.41%) PSD2
System Software
1 12 (4.92%) Docker
2 11 (4.51%) VMware Infrastructure
3 9 (3.69%) Virtual Desktop
4 4 (1.64%) Active Directory
5 2 (0.82%) Virtual Machines
6 1 (0.41%) Hyper-V
Systems Management
1 25 (10.25%) Terraform
2 13 (5.33%) Kubernetes
3 12 (4.92%) Grafana
3 12 (4.92%) Prometheus
4 3 (1.23%) Single Sign-On
5 2 (0.82%) Ansible
5 2 (0.82%) Avamar
5 2 (0.82%) NetBackup
5 2 (0.82%) Tivoli Storage Manager
6 1 (0.41%) Computer Emergency Response Teams
6 1 (0.41%) Microsoft Intune
6 1 (0.41%) Progress Chef
6 1 (0.41%) Puppet
Vendors
1 30 (12.30%) Microsoft
2 16 (6.56%) Citrix
3 13 (5.33%) VMware
4 8 (3.28%) Google
5 7 (2.87%) Databricks
5 7 (2.87%) Murex
6 6 (2.46%) Red Hat
7 5 (2.05%) Charles River
7 5 (2.05%) Tanium
8 4 (1.64%) Oracle
8 4 (1.64%) ServiceNow
9 2 (0.82%) Avaloq
9 2 (0.82%) eFront
9 2 (0.82%) Salesforce
9 2 (0.82%) SAP
9 2 (0.82%) Veeam
9 2 (0.82%) Workday
10 1 (0.41%) DocuSign
10 1 (0.41%) FIS
10 1 (0.41%) OneTrust