C++ Job Trends in London

C++
England > London

The table below provides summary statistics and salary benchmarking for jobs advertised in London requiring C++ skills. It covers permanent job vacancies from the 6 months leading up to 8 November 2025, with comparisons to the same periods in the previous two years.

6 months to
8 Nov 2025
Same period 2024 Same period 2023
Rank 155 158 111
Rank change year-on-year +3 -47 +28
Permanent jobs citing C++ 244 378 540
As % of all permanent jobs in London 1.98% 2.18% 2.78%
As % of the Programming Languages category 5.38% 5.16% 6.14%
Number of salaries quoted 136 244 438
10th Percentile £59,125 £49,125 £52,500
25th Percentile £85,000 £66,875 £67,500
Median annual salary (50th Percentile) £110,000 £90,000 £100,000
Median % change year-on-year +22.22% -10.00% +25.00%
75th Percentile £140,625 £115,000 £140,000
90th Percentile £170,000 £135,000 £170,000
England median annual salary £65,000 £65,000 £65,000

All Programming Languages
London

C++ falls under the Programming Languages category. For comparison with the information above, the following table provides summary statistics for all permanent job vacancies requiring coding skills in London.

Permanent vacancies with a requirement for coding skills 4,539 7,326 8,793
As % of all permanent jobs advertised in London 36.84% 42.30% 45.19%
Number of salaries quoted 3,004 4,820 7,665
10th Percentile £47,500 £50,000 £50,000
25th Percentile £61,813 £62,500 £61,250
Median annual salary (50th Percentile) £81,250 £80,000 £80,000
Median % change year-on-year +1.56% - +6.67%
75th Percentile £110,000 £108,750 £100,000
90th Percentile £135,000 £130,000 £125,000
England median annual salary £62,500 £65,000 £65,000
% change year-on-year -3.85% - -

C++
Job Vacancy Trend in London

Historical trend showing the proportion of permanent IT job postings citing C++ relative to all permanent IT jobs advertised in London.
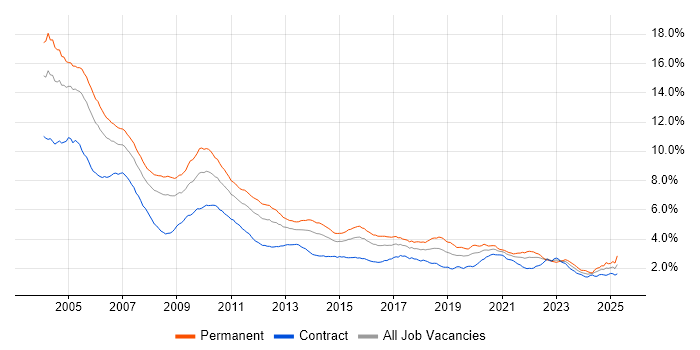
C++ job vacancy trend in London

C++
Salary Trend in London

Salary distribution trend for jobs in London citing C++.

Salary distribution trend for jobs in London citing C++

C++
Salary Histogram in London

Salary distribution for jobs citing C++ in London over the 6 months to 8 November 2025.

Salary histogram for C++ in London

C++
Job Locations in London

The table below looks at the demand and provides a guide to the median salaries quoted in IT jobs citing C++ within the London region over the 6 months to 8 November 2025. The 'Rank Change' column provides an indication of the change in demand within each location based on the same 6 month period last year.

Location Rank Change
on Same Period
Last Year
Matching
Permanent
IT Job Ads
Median Salary
Past 6 Months
Median Salary
% Change
on Same Period
Last Year
Live
Jobs
Central London +39 41 £125,000 +21.95% 259
C++
England

C++
Co-Occurring Skills & Capabilities in London by Category

The following tables expand on the one above by listing co-occurrences grouped by category. They cover the same employment type, locality and period, with up to 20 co-occurrences shown in each category:

Application Platforms
1 2 (0.82%) Apache Spark
2 1 (0.41%) Apache
2 1 (0.41%) Jupyter
Applications
1 1 (0.41%) Microsoft Office
Cloud Services
1 29 (11.89%) AWS
2 11 (4.51%) Azure
3 5 (2.05%) GCP
4 4 (1.64%) GitHub
5 3 (1.23%) Amazon CloudWatch
5 3 (1.23%) Amazon OpenSearch
6 2 (0.82%) Azure Machine Learning
6 2 (0.82%) OpenShift
7 1 (0.41%) Amazon EC2
7 1 (0.41%) Amazon EKS
7 1 (0.41%) Amazon S3
7 1 (0.41%) AWS CloudFormation
7 1 (0.41%) AWS Lambda
7 1 (0.41%) Datadog
7 1 (0.41%) Entra ID
7 1 (0.41%) GitHub Actions
7 1 (0.41%) Google Workspace
7 1 (0.41%) Microsoft 365
7 1 (0.41%) Serverless
Communications & Networking
1 22 (9.02%) TCP/IP
2 16 (6.56%) Multicast
3 2 (0.82%) Wi-Fi
4 1 (0.41%) Bluetooth
4 1 (0.41%) Broadband
4 1 (0.41%) DHCP
4 1 (0.41%) DOCSIS
4 1 (0.41%) DSL
4 1 (0.41%) Firewall
4 1 (0.41%) GPON
4 1 (0.41%) IPv4
4 1 (0.41%) IPv6
4 1 (0.41%) PPP
4 1 (0.41%) RTP
4 1 (0.41%) VoIP
4 1 (0.41%) WAN
Database & Business Intelligence
1 16 (6.56%) KDB
2 12 (4.92%) Kdb+
3 10 (4.10%) ClickHouse
4 6 (2.46%) NoSQL
5 5 (2.05%) Redis
6 3 (1.23%) CockroachDB
7 2 (0.82%) Big Data
7 2 (0.82%) Tick Data
8 1 (0.41%) Apache Cassandra
8 1 (0.41%) Elasticsearch
8 1 (0.41%) Hadoop
8 1 (0.41%) MongoDB
8 1 (0.41%) Neo4j
8 1 (0.41%) Parquet
8 1 (0.41%) PostgreSQL
Development Applications
1 13 (5.33%) Git
2 9 (3.69%) JIRA
3 5 (2.05%) Jenkins
4 4 (1.64%) GitLab
4 4 (1.64%) JUnit
4 4 (1.64%) Mockito
5 3 (1.23%) Sonatype Nexus
6 2 (0.82%) CircleCI
7 1 (0.41%) CMake
7 1 (0.41%) Cucumber
7 1 (0.41%) GCC
7 1 (0.41%) GDB
7 1 (0.41%) IntelliJ
7 1 (0.41%) Maven
7 1 (0.41%) MSBuild
7 1 (0.41%) TeamCity
7 1 (0.41%) Visual Studio
General
1 131 (53.69%) Finance
2 75 (30.74%) Banking
3 59 (24.18%) Front Office
4 36 (14.75%) Investment Banking
5 31 (12.70%) Law
6 28 (11.48%) Inclusion and Diversity
7 25 (10.25%) Social Skills
8 20 (8.20%) Analytical Skills
9 18 (7.38%) Public Sector
10 10 (4.10%) Telecoms
11 8 (3.28%) Electronics
12 7 (2.87%) Games
12 7 (2.87%) Manufacturing
12 7 (2.87%) Marketing
13 6 (2.46%) Back Office
14 5 (2.05%) Financial Institution
14 5 (2.05%) Publishing
15 3 (1.23%) Wholesale Banking
16 2 (0.82%) Military
17 1 (0.41%) Advertising
Job Titles
1 112 (45.90%) Developer
2 75 (30.74%) Senior
3 74 (30.33%) C++ Developer
4 73 (29.92%) Software Engineer
5 42 (17.21%) Lead
6 39 (15.98%) Low Latency C++ Developer
7 38 (15.57%) Linux Developer
7 38 (15.57%) Quantitative Developer
8 34 (13.93%) Senior Software Engineer
9 31 (12.70%) Senior Developer
10 30 (12.30%) Python Developer
11 27 (11.07%) Cloud Engineer
12 26 (10.66%) Cloud Native Engineer
12 26 (10.66%) Cloud Software Engineer
12 26 (10.66%) Investment Banking C++ Developer
13 24 (9.84%) Lead Software Engineer
14 23 (9.43%) Senior C++ Developer
15 22 (9.02%) C++ Quantitative Developer
15 22 (9.02%) Senior Python Developer
15 22 (9.02%) Senior Quantitative Developer
Libraries, Frameworks & Software Standards
1 30 (12.30%) Boost C++ Libraries
2 23 (9.43%) FIX Protocol
3 9 (3.69%) Kafka
4 8 (3.28%) pytest
4 8 (3.28%) React
5 6 (2.46%) PyXLL
6 5 (2.05%) .NET
6 5 (2.05%) AngularJS
6 5 (2.05%) PyTorch
6 5 (2.05%) RESTful
6 5 (2.05%) Spring
6 5 (2.05%) Spring Boot
6 5 (2.05%) TensorFlow
7 4 (1.64%) gRPC
7 4 (1.64%) Protocol Buffers
8 3 (1.23%) .NET Framework
8 3 (1.23%) Node.js
9 2 (0.82%) Keras
9 2 (0.82%) STL
9 2 (0.82%) Vue
Miscellaneous
1 52 (21.31%) Algorithms
2 40 (16.39%) Distributed Systems
3 38 (15.57%) Cloud Native
4 35 (14.34%) Equities
5 31 (12.70%) Data Structures
5 31 (12.70%) Hedge funds
6 29 (11.89%) Derivative
7 26 (10.66%) Legacy Code
8 21 (8.61%) Foreign Exchange (FX)
8 21 (8.61%) Management Information System
9 20 (8.20%) FPGA
10 16 (6.56%) Fixed Income
11 12 (4.92%) Public Cloud
12 9 (3.69%) Greenfield Project
13 8 (3.28%) Grid Computing
13 8 (3.28%) Market Risk
14 5 (2.05%) Data Protection Act
15 4 (1.64%) Enterprise Software
15 4 (1.64%) Equity Derivative
15 4 (1.64%) Robotics
Operating Systems
1 102 (41.80%) Linux
2 7 (2.87%) Red Hat Enterprise Linux
3 5 (2.05%) Unix
4 4 (1.64%) Windows
5 1 (0.41%) Android
5 1 (0.41%) Embedded Linux
5 1 (0.41%) Mac OS
5 1 (0.41%) OpenWrt
5 1 (0.41%) Robot Operating System
Processes & Methodologies
1 92 (37.70%) Software Engineering
2 85 (34.84%) Low Latency
3 77 (31.56%) Agile
4 44 (18.03%) Problem-Solving
5 43 (17.62%) SDLC
6 41 (16.80%) AI
6 41 (16.80%) Computer Science
7 38 (15.57%) Test Automation
8 33 (13.52%) Analytics
8 33 (13.52%) Machine Learning
9 31 (12.70%) Mathematics
10 29 (11.89%) OO
10 29 (11.89%) OOP
11 27 (11.07%) CI/CD
11 27 (11.07%) Operational Stability
12 26 (10.66%) Technical Leadership
13 25 (10.25%) Order Management
14 22 (9.02%) Open Source
15 21 (8.61%) DevOps
15 21 (8.61%) Multithreading
Programming Languages
1 135 (55.33%) Python
2 104 (42.62%) Java
3 70 (28.69%) C
4 43 (17.62%) C#
5 39 (15.98%) Rust
6 31 (12.70%) Go
7 29 (11.89%) SQL
8 18 (7.38%) TypeScript
9 12 (4.92%) JavaScript
10 5 (2.05%) MATLAB
11 4 (1.64%) Bash
11 4 (1.64%) Embedded C
11 4 (1.64%) Ruby
12 3 (1.23%) Groovy
12 3 (1.23%) Kotlin
12 3 (1.23%) PowerShell
13 1 (0.41%) Dart
13 1 (0.41%) Google Apps Script
13 1 (0.41%) R
13 1 (0.41%) Solidity
Qualifications
1 25 (10.25%) Degree
2 19 (7.79%) Security Cleared
3 15 (6.15%) DV Cleared
4 14 (5.74%) SC Cleared
5 13 (5.33%) Master's Degree
6 10 (4.10%) Computer Science Degree
7 5 (2.05%) PhD
8 4 (1.64%) AWS Certification
9 1 (0.41%) AWS Certified Developer
9 1 (0.41%) AWS Certified Solutions Architect
9 1 (0.41%) Numerate Degree
Quality Assurance & Compliance
1 9 (3.69%) QA
2 2 (0.82%) Data Quality
2 2 (0.82%) EMIR
3 1 (0.41%) MiFID
System Software
1 14 (5.74%) Virtual Machines
1 14 (5.74%) Virtual Servers
2 7 (2.87%) Docker
3 3 (1.23%) Firmware
4 2 (0.82%) Embedded Firmware
5 1 (0.41%) KVM
5 1 (0.41%) VMware Infrastructure
Systems Management
1 50 (20.49%) Kubernetes
2 14 (5.74%) Terraform
3 5 (2.05%) Grafana
4 4 (1.64%) Ansible
4 4 (1.64%) Prometheus
5 1 (0.41%) Microsoft Intune
5 1 (0.41%) Progress Chef
5 1 (0.41%) Puppet
5 1 (0.41%) systemd
Vendors
1 18 (7.38%) Palantir
2 10 (4.10%) Foundry
3 7 (2.87%) SAP
4 6 (2.46%) Oracle
4 6 (2.46%) Red Hat
5 5 (2.05%) Google
6 4 (1.64%) Confluent
6 4 (1.64%) Microsoft
7 3 (1.23%) Cribl.io
7 3 (1.23%) Sonatype
8 2 (0.82%) Solarflare
9 1 (0.41%) Apple
9 1 (0.41%) IBM
9 1 (0.41%) ION Trading
9 1 (0.41%) UiPath
9 1 (0.41%) VMware