Continuous Integration Jobs

Continuous Integration
UK

The table below provides summary statistics for permanent job vacancies requiring Continuous Integration skills. It includes a benchmarking guide to the annual salaries offered in vacancies that cited Continuous Integration over the 6 months leading up to 22 January 2025, comparing them to the same period in the previous two years.

6 months to
22 Jan 2025
Same period 2024 Same period 2023
Rank 172 153 111
Rank change year-on-year -19 -42 -38
Permanent jobs citing Continuous Integration 1,156 1,362 3,226
As % of all permanent jobs advertised in the UK 1.77% 2.08% 2.99%
As % of the Processes & Methodologies category 1.92% 2.32% 3.14%
Number of salaries quoted 495 908 1,994
10th Percentile £47,500 £42,675 £46,250
25th Percentile £55,000 £50,639 £55,000
Median annual salary (50th Percentile) £69,308 £65,000 £70,000
Median % change year-on-year +6.63% -7.14% +7.69%
75th Percentile £85,000 £86,250 £87,500
90th Percentile £109,500 £97,500 £105,000
UK excluding London median annual salary £65,000 £60,000 £65,000
% change year-on-year +8.33% -7.69% +13.04%

All Process and Methodology Skills
UK

Continuous Integration falls under the Processes and Methodologies category. For comparison with the information above, the following table provides summary statistics for all permanent job vacancies requiring process or methodology skills.

Permanent vacancies with a requirement for process or methodology skills 60,221 58,708 102,785
As % of all permanent jobs advertised in the UK 92.29% 89.66% 95.42%
Number of salaries quoted 26,015 43,044 64,747
10th Percentile £35,000 £30,500 £35,000
25th Percentile £45,383 £41,250 £46,250
Median annual salary (50th Percentile) £60,000 £57,500 £62,500
Median % change year-on-year +4.35% -8.00% +4.17%
75th Percentile £77,500 £77,500 £82,500
90th Percentile £98,750 £96,250 £100,000
UK excluding London median annual salary £55,000 £50,000 £55,000
% change year-on-year +10.00% -9.09% +10.00%

Continuous Integration
Job Vacancy Trend

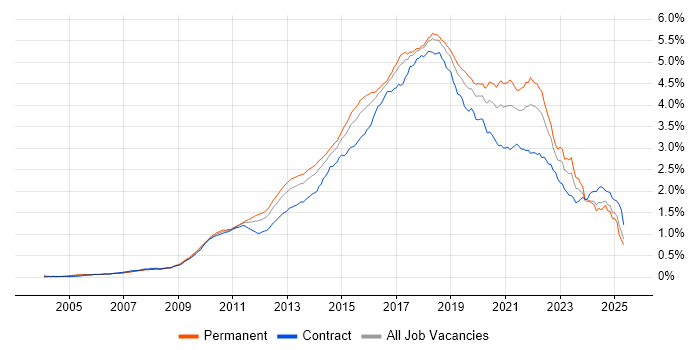
Job postings citing Continuous Integration as a proportion of all IT jobs advertised.

Job vacancy trend for Continuous Integration in the UK

Continuous Integration
Salary Trend

3-month moving average salary quoted in jobs citing Continuous Integration.

Salary trend for Continuous Integration in the UK

Continuous Integration
Salary Histogram

Salary distribution for jobs citing Continuous Integration over the 6 months to 22 January 2025.

Salary histogram for Continuous Integration in the UK

Continuous Integration
Top 17 Job Locations

The table below looks at the demand and provides a guide to the median salaries quoted in IT jobs citing Continuous Integration within the UK over the 6 months to 22 January 2025. The 'Rank Change' column provides an indication of the change in demand within each location based on the same 6 month period last year.

Location Rank Change
on Same Period
Last Year
Matching
Permanent
IT Job Ads
Median Salary
Past 6 Months
Median Salary
% Change
on Same Period
Last Year
Live
Jobs
England +1 1,055 £70,000 +7.69% 283
UK excluding London -58 603 £65,000 +8.33% 168
Work from Home -16 563 £69,308 +6.63% 309
London +63 535 £76,000 -7.88% 124
South East +32 202 £65,000 +11.40% 35
North of England -51 145 £60,000 +4.35% 60
Midlands -33 86 £65,000 +20.37% 20
North West -40 79 £60,000 +3.93% 33
Scotland -19 70 £69,308 +6.63% 15
South West -51 65 £70,513 +12.82% 26
West Midlands -39 64 £69,308 +24.88% 17
Yorkshire -6 48 £50,000 -11.22% 13
East of England -44 23 £70,000 +27.27% 13
East Midlands -16 22 £65,000 +30.03% 3
North East -14 18 £69,308 +15.51% 14
Wales +11 13 £60,950 +10.82% 2
Northern Ireland 0 6 £69,308 +6.63%

Continuous Integration
Co-occurring Skills and Capabilities by Category

The follow tables expand on the table above by listing co-occurrences grouped by category. The same employment type, locality and period is covered with up to 20 co-occurrences shown in each of the following categories:

Application Platforms
1 84 (7.27%) Confluence
2 12 (1.04%) SharePoint
3 8 (0.69%) CMS
4 7 (0.61%) Drupal
5 5 (0.43%) Apache
6 4 (0.35%) nginx
7 3 (0.26%) Apache Airflow
8 2 (0.17%) Apache Spark
8 2 (0.17%) Jupyter
8 2 (0.17%) Tomcat
8 2 (0.17%) WebSphere
8 2 (0.17%) WebSphere Application Server
9 1 (0.087%) IIS
9 1 (0.087%) Magnolia
9 1 (0.087%) Umbraco
9 1 (0.087%) WordPress
Applications
1 19 (1.64%) Simulink
2 9 (0.78%) Microsoft Excel
3 3 (0.26%) MS Visio
4 2 (0.17%) Adobe XD
4 2 (0.17%) Microsoft Project
5 1 (0.087%) InDesign
5 1 (0.087%) Microsoft Office
5 1 (0.087%) OrCAD
5 1 (0.087%) Photoshop
5 1 (0.087%) Trello
Business Applications
1 18 (1.56%) Dynamics CRM
2 6 (0.52%) Shopify
3 4 (0.35%) Oracle BPM
4 2 (0.17%) Cloudability
4 2 (0.17%) Oracle Subledger Accounting
5 1 (0.087%) LabWindows
5 1 (0.087%) Orchestrade
5 1 (0.087%) Sparx Enterprise Architect
Cloud Services
1 345 (29.84%) Azure
2 293 (25.35%) AWS
3 124 (10.73%) GCP
4 117 (10.12%) Azure DevOps
5 87 (7.53%) Serverless
6 78 (6.75%) SaaS
7 66 (5.71%) AWS Lambda
8 50 (4.33%) AWS CloudFormation
8 50 (4.33%) GitHub
9 44 (3.81%) PaaS
10 39 (3.37%) Power Platform
11 37 (3.20%) Amazon S3
12 31 (2.68%) dbt
13 30 (2.60%) Azure Functions
14 29 (2.51%) Dynamics 365
15 27 (2.34%) Amazon SQS
15 27 (2.34%) Cloud Computing
16 26 (2.25%) Amazon ECS
17 25 (2.16%) Amazon ECR
18 22 (1.90%) Pulumi
Communications & Networking
1 231 (19.98%) Broadband
2 50 (4.33%) Internet
3 26 (2.25%) TCP/IP
4 25 (2.16%) Firewall
5 19 (1.64%) Network Security
6 16 (1.38%) HTTP
7 15 (1.30%) SSL
8 12 (1.04%) Software-Defined Radio
9 11 (0.95%) VPN
10 9 (0.78%) WAN
11 8 (0.69%) DNS
12 7 (0.61%) Kerberos
12 7 (0.61%) LAN
12 7 (0.61%) Wireless
13 5 (0.43%) Bluetooth
13 5 (0.43%) FTP
13 5 (0.43%) Intrusion Detection
13 5 (0.43%) Modbus
14 4 (0.35%) MQTT
15 3 (0.26%) 5G
Database & Business Intelligence
1 152 (13.15%) Relational Database
2 147 (12.72%) MySQL
3 137 (11.85%) MongoDB
4 81 (7.01%) NoSQL
5 70 (6.06%) SQL Server
6 65 (5.62%) PostgreSQL
7 43 (3.72%) Elasticsearch
8 34 (2.94%) Amazon RDS
9 25 (2.16%) Redis
10 14 (1.21%) Azure SQL Database
10 14 (1.21%) Power BI
11 13 (1.12%) RDBMS
12 11 (0.95%) DynamoDB
13 10 (0.87%) SQL Server Integration Services
14 9 (0.78%) Big Data
14 9 (0.78%) Data Warehouse
15 8 (0.69%) Data Lake
15 8 (0.69%) SQL Server Reporting Services
16 7 (0.61%) DB2
16 7 (0.61%) SQL Server Analysis Services
Development Applications
1 309 (26.73%) Git
2 155 (13.41%) Jenkins
3 154 (13.32%) GitLab
4 145 (12.54%) JIRA
5 79 (6.83%) Maven
6 58 (5.02%) TeamCity
7 55 (4.76%) Sonatype Nexus
8 53 (4.58%) Bitbucket
9 40 (3.46%) Mockito
9 40 (3.46%) SonarQube
10 33 (2.85%) Ant
11 31 (2.68%) Selenium
12 30 (2.60%) Gradle
13 29 (2.51%) JUnit
13 29 (2.51%) Visual Studio
14 24 (2.08%) Team Foundation Server
15 22 (1.90%) Cucumber
16 21 (1.82%) webpack
17 17 (1.47%) Atlassian Bamboo
18 15 (1.30%) Octopus Deploy
General
1 372 (32.18%) Social Skills
2 194 (16.78%) Analytical Skills
3 164 (14.19%) Finance
4 71 (6.14%) Inclusion and Diversity
5 67 (5.80%) Banking
6 37 (3.20%) Military
7 29 (2.51%) Influencing Skills
8 28 (2.42%) Publishing
9 27 (2.34%) Law
10 25 (2.16%) Electronics
10 25 (2.16%) Tech for Good
11 22 (1.90%) Health Technology
11 22 (1.90%) Organisational Skills
12 21 (1.82%) Manufacturing
13 20 (1.73%) Marketing
13 20 (1.73%) Public Sector
14 18 (1.56%) Legal
15 16 (1.38%) Games
16 13 (1.12%) Front Office
17 12 (1.04%) Retail
Job Titles
1 278 (24.05%) Developer
2 225 (19.46%) Senior
3 222 (19.20%) Lead
4 163 (14.10%) Software Engineer
5 140 (12.11%) Team Leader
6 103 (8.91%) Architect
7 95 (8.22%) Product Manager
7 95 (8.22%) Technical Manager
7 95 (8.22%) Technical Product Manager
8 81 (7.01%) Senior Developer
9 62 (5.36%) Senior Software Engineer
10 61 (5.28%) Software Developer
11 52 (4.50%) Solutions Architect
12 50 (4.33%) Java Developer
13 40 (3.46%) DevOps Engineer
14 38 (3.29%) Infrastructure Engineer
15 37 (3.20%) Analyst
16 36 (3.11%) AWS Engineer
17 33 (2.85%) Cloud Engineer
18 32 (2.77%) Platform Engineer
Libraries, Frameworks & Software Standards
1 165 (14.27%) .NET
2 143 (12.37%) Elastic Stack
3 132 (11.42%) RESTful
4 115 (9.95%) React
5 84 (7.27%) Middleware
5 84 (7.27%) REST
6 80 (6.92%) Spring
7 73 (6.31%) Kafka
8 67 (5.80%) CSS
8 67 (5.80%) Spring Boot
9 60 (5.19%) OAuth
10 59 (5.10%) Node.js
11 53 (4.58%) OAuth2
11 53 (4.58%) SAML
12 52 (4.50%) HTML
13 50 (4.33%) Web Services
14 49 (4.24%) Django
15 43 (3.72%) .NET Framework
16 41 (3.55%) RabbitMQ
17 39 (3.37%) XML
Miscellaneous
1 141 (12.20%) Private Cloud
2 129 (11.16%) Product Ownership
3 123 (10.64%) Cloud Native
4 74 (6.40%) Distributed Systems
5 53 (4.58%) Management Information System
6 35 (3.03%) Algorithms
7 23 (1.99%) Enterprise Software
8 22 (1.90%) Public Cloud
9 20 (1.73%) Mobile App
10 18 (1.56%) Legacy Code
11 15 (1.30%) Data Structures
11 15 (1.30%) IoT
12 14 (1.21%) Linux Command Line
13 13 (1.12%) Legacy Applications
13 13 (1.12%) Virtual Team
14 12 (1.04%) FPGA
14 12 (1.04%) Molecular Biology
14 12 (1.04%) VHDL
15 11 (0.95%) Security Posture
16 10 (0.87%) Self-Motivation
Operating Systems
1 351 (30.36%) Linux
2 67 (5.80%) Windows
3 47 (4.07%) Unix
4 36 (3.11%) Embedded Linux
5 28 (2.42%) Android
5 28 (2.42%) Red Hat Enterprise Linux
6 27 (2.34%) Apple iOS
7 13 (1.12%) zOS
8 12 (1.04%) Debian
8 12 (1.04%) Solaris
9 9 (0.78%) CentOS
9 9 (0.78%) Ubuntu
10 6 (0.52%) Robot Operating System
10 6 (0.52%) Windows Server
11 3 (0.26%) VMS
12 2 (0.17%) Windows Server 2019
13 1 (0.087%) Amazon Linux
13 1 (0.087%) Fedora
13 1 (0.087%) Rocky
Processes & Methodologies
1 703 (60.81%) CI/CD
2 613 (53.03%) DevOps
3 572 (49.48%) Agile
4 387 (33.48%) Mentoring
5 377 (32.61%) Software Engineering
6 329 (28.46%) Continuous Deployment
7 309 (26.73%) Problem-Solving
8 273 (23.62%) Microservices
9 271 (23.44%) Configuration Management
10 259 (22.40%) Continuous Delivery
11 239 (20.67%) Roadmaps
11 239 (20.67%) TDD
12 234 (20.24%) Containerisation
13 229 (19.81%) Continuous Improvement
14 215 (18.60%) Computer Science
15 204 (17.65%) Test Automation
16 194 (16.78%) Design Patterns
17 179 (15.48%) Validation
18 172 (14.88%) Scrum
19 167 (14.45%) Deployment Automation
Programming Languages
1 366 (31.66%) Python
2 207 (17.91%) Java
3 184 (15.92%) C#
4 162 (14.01%) Bash
5 148 (12.80%) JavaScript
6 137 (11.85%) SQL
7 133 (11.51%) Shell Script
8 103 (8.91%) TypeScript
9 75 (6.49%) C++
10 58 (5.02%) C
11 56 (4.84%) Go
12 42 (3.63%) PowerShell
13 24 (2.08%) Kotlin
14 19 (1.64%) PHP
15 18 (1.56%) Swift
15 18 (1.56%) VB
16 15 (1.30%) Ada
17 14 (1.21%) Rust
18 13 (1.12%) MATLAB
19 10 (0.87%) Perl
Qualifications
1 277 (23.96%) Degree
2 177 (15.31%) Computer Science Degree
3 163 (14.10%) Master's Degree
4 152 (13.15%) Security Cleared
5 131 (11.33%) LPIC
6 123 (10.64%) RHCSA
7 111 (9.60%) SC Cleared
8 45 (3.89%) BPSS Clearance
8 45 (3.89%) DV Cleared
9 20 (1.73%) Microsoft Certification
10 14 (1.21%) Azure Certification
11 12 (1.04%) PhD
12 10 (0.87%) AWS Certification
13 8 (0.69%) RHCE
14 6 (0.52%) Cisco Certification
15 5 (0.43%) Numerate Degree
16 4 (0.35%) CISSP
16 4 (0.35%) ISTQB
17 2 (0.17%) CCNP
17 2 (0.17%) Chartered Engineer
Quality Assurance & Compliance
1 189 (16.35%) QA
2 133 (11.51%) NIST
3 123 (10.64%) SOC 2
4 37 (3.20%) Accessibility
5 31 (2.68%) Sarbanes-Oxley
6 15 (1.30%) GDPR
7 11 (0.95%) ISO/IEC 27001
8 9 (0.78%) Data Quality
9 5 (0.43%) HIPAA
10 4 (0.35%) Software Quality Assurance
11 3 (0.26%) Cyber Essentials
11 3 (0.26%) IEC 62304
11 3 (0.26%) ISO 13485
11 3 (0.26%) WCAG
12 2 (0.17%) Cyber Essentials PLUS
13 1 (0.087%) Basel III
13 1 (0.087%) Disclosure Scotland
13 1 (0.087%) IFRS
13 1 (0.087%) IFRS 9
13 1 (0.087%) NCSC
System Software
1 389 (33.65%) Docker
2 17 (1.47%) Firmware
3 16 (1.38%) Active Directory
4 9 (0.78%) Virtual Machines
5 5 (0.43%) Embedded Firmware
6 4 (0.35%) RACF
6 4 (0.35%) VMware Infrastructure
7 3 (0.26%) Slurm Workload Manager
8 2 (0.17%) Hyper-V
8 2 (0.17%) KVM
8 2 (0.17%) NFS
8 2 (0.17%) SRDF
8 2 (0.17%) Veritas Cluster Server
8 2 (0.17%) Xen
9 1 (0.087%) Postfix
9 1 (0.087%) VMware NSX
Systems Management
1 266 (23.01%) Kubernetes
2 215 (18.60%) Ansible
3 160 (13.84%) Terraform
4 155 (13.41%) Grafana
5 148 (12.80%) Prometheus
6 37 (3.20%) Puppet
7 29 (2.51%) Progress Chef
8 20 (1.73%) AWS Copilot
9 11 (0.95%) Nagios
10 10 (0.87%) Argo
11 9 (0.78%) Packer
12 7 (0.61%) Istio
13 5 (0.43%) Consul
13 5 (0.43%) Rundeck
14 4 (0.35%) Kibana
14 4 (0.35%) Single Sign-On
15 3 (0.26%) Control-M
15 3 (0.26%) Galera Cluster
16 2 (0.17%) Rancher
16 2 (0.17%) zSecure
Vendors
1 121 (10.47%) Microsoft
2 68 (5.88%) Google
3 45 (3.89%) Atlassian
4 33 (2.85%) Red Hat
5 22 (1.90%) Databricks
6 18 (1.56%) Oracle
6 18 (1.56%) Xilinx
7 14 (1.21%) Apple
8 13 (1.12%) ServiceNow
9 9 (0.78%) IBM
10 8 (0.69%) Brio
11 7 (0.61%) AppDynamics
11 7 (0.61%) Cisco
11 7 (0.61%) Splunk
11 7 (0.61%) Sybase
12 5 (0.43%) VMware
13 4 (0.35%) F5
13 4 (0.35%) ForgeRock
13 4 (0.35%) Fortinet
13 4 (0.35%) Trayport