Linux Command Line Jobs

Linux/Unix Command Line Interface (CLI)
UK

The table below looks at the prevalence of the term Linux Command Line in permanent job vacancies. Included is a benchmarking guide to the salaries offered in vacancies that cited Linux Command Line over the 6 months leading up to 26 October 2024, comparing them to the same period in the previous two years.

6 months to
26 Oct 2024
Same period 2023 Same period 2022
Rank 576 573 620
Rank change year-on-year -3 +47 -97
Permanent jobs citing Linux Command Line 211 197 619
As % of all permanent jobs advertised in the UK 0.28% 0.34% 0.44%
As % of the Miscellaneous category 0.85% 0.88% 0.97%
Number of salaries quoted 125 165 286
10th Percentile £30,000 £38,000 £30,000
25th Percentile £41,250 £47,500 £40,000
Median annual salary (50th Percentile) £55,000 £62,500 £55,000
Median % change year-on-year -12.00% +13.64% -
75th Percentile £77,500 £86,250 £77,500
90th Percentile £85,000 £96,539 £107,500
UK excluding London median annual salary £47,500 £62,500 £50,000
% change year-on-year -24.00% +25.00% -

All Generic Skills
UK

Linux Command Line falls under the General and Transferable Skills category. For comparison with the information above, the following table provides summary statistics for all permanent job vacancies requiring generic IT skills.

Permanent vacancies with a requirement for generic IT skills 24,750 22,260 64,109
As % of all permanent jobs advertised in the UK 32.56% 37.91% 45.44%
Number of salaries quoted 10,956 16,186 31,701
10th Percentile £32,875 £34,234 £35,000
25th Percentile £45,628 £45,321 £46,250
Median annual salary (50th Percentile) £60,000 £62,500 £62,500
Median % change year-on-year -4.00% - +4.17%
75th Percentile £83,750 £83,750 £85,000
90th Percentile £110,000 £106,250 £105,000
UK excluding London median annual salary £54,000 £55,000 £55,000
% change year-on-year -1.82% - +10.00%

Linux Command Line
Job Vacancy Trend

Job postings citing Linux Command Line as a proportion of all IT jobs advertised.
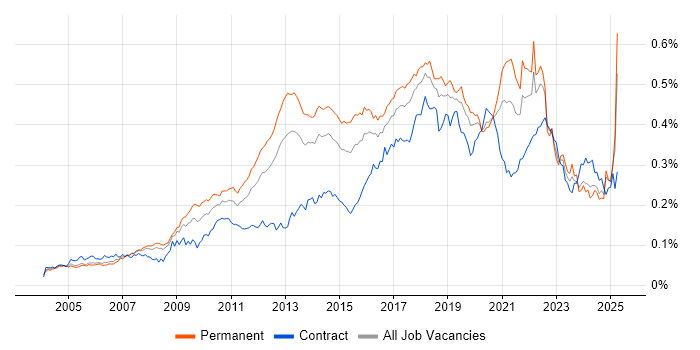
Job vacancy trend for Linux Command Line in the UK

Linux Command Line
Salary Trend

3-month moving average salary quoted in jobs citing Linux Command Line.

Salary trend for Linux Command Line in the UK

Linux Command Line
Salary Histogram

Salary distribution for jobs citing Linux Command Line over the 6 months to 26 October 2024.

Salary histogram for Linux Command Line in the UK

Linux Command Line
Top 15 Job Locations

The table below looks at the demand and provides a guide to the median salaries quoted in IT jobs citing Linux Command Line within the UK over the 6 months to 26 October 2024. The 'Rank Change' column provides an indication of the change in demand within each location based on the same 6 month period last year.

Location Rank Change
on Same Period
Last Year
Matching
Permanent
IT Job Ads
Median Salary
Past 6 Months
Median Salary
% Change
on Same Period
Last Year
Live
Jobs
England -28 205 £55,000 -12.00% 60
UK excluding London -2 149 £47,500 -24.00% 45
Work from Home -16 73 £67,500 +8.00% 46
London +5 61 £63,750 +2.00% 21
North of England -2 44 £38,250 -55.00% 6
South East -10 44 £27,500 -35.29% 17
South West +25 34 £75,000 +50.00% 3
Yorkshire +49 33 £38,250 -55.00% 4
East of England -46 12 £55,000 -35.29% 7
Midlands -25 10 £32,500 -40.91% 7
North West -46 10 £45,000 -51.50% 1
West Midlands - 8 £32,500 - 2
Scotland -8 5 £52,500 -43.41% 5
East Midlands - 2 - - 5
North East - 1 - - 1

Linux Command Line
Co-occurring Skills and Capabilities by Category

The follow tables expand on the table above by listing co-occurrences grouped by category. The same employment type, locality and period is covered with up to 20 co-occurrences shown in each of the following categories:

Application Platforms
1 6 (2.84%) Confluence
2 5 (2.37%) WordPress
3 4 (1.90%) CMS
4 3 (1.42%) Headless CMS
4 3 (1.42%) Microsoft Exchange
5 2 (0.95%) IIS
6 1 (0.47%) Joomla!
6 1 (0.47%) nginx
Applications
1 2 (0.95%) Microsoft Office
1 2 (0.95%) MS Visio
2 1 (0.47%) Microsoft Excel
2 1 (0.47%) Photoshop
Business Applications
1 11 (5.21%) Remedy ITSM
2 5 (2.37%) Oracle EBS
2 5 (2.37%) Oracle ERP
2 5 (2.37%) PeopleSoft HCM
3 1 (0.47%) Infor M3
3 1 (0.47%) WebTrends
Cloud Services
1 83 (39.34%) Azure
2 67 (31.75%) AWS
3 22 (10.43%) Entra ID
3 22 (10.43%) Microsoft 365
4 20 (9.48%) Azure Monitor
5 19 (9.00%) IaaS
6 16 (7.58%) Azure Storage
7 14 (6.64%) Azure DevOps
7 14 (6.64%) GCP
7 14 (6.64%) SaaS
8 13 (6.16%) OpenShift
9 12 (5.69%) Cloud Computing
9 12 (5.69%) PaaS
10 9 (4.27%) Amazon CloudWatch
10 9 (4.27%) GitHub
11 6 (2.84%) Azure AKS
11 6 (2.84%) OCI
12 4 (1.90%) AWS CloudFormation
12 4 (1.90%) Azure Cosmos DB
12 4 (1.90%) GitHub Actions
Communications & Networking
1 33 (15.64%) Firewall
2 31 (14.69%) DNS
3 21 (9.95%) DHCP
4 13 (6.16%) VPN
5 11 (5.21%) Network Security
6 10 (4.74%) Internet
7 9 (4.27%) HTTP
8 8 (3.79%) TCP/IP
8 8 (3.79%) VLAN
9 7 (3.32%) VoIP
9 7 (3.32%) Wi-Fi
10 6 (2.84%) IPsec
10 6 (2.84%) LAN
10 6 (2.84%) WAN
11 5 (2.37%) BGP
11 5 (2.37%) OSPF
11 5 (2.37%) SAN
11 5 (2.37%) SSL
12 4 (1.90%) Ethernet VPN
13 3 (1.42%) HTTPS
Database & Business Intelligence
1 11 (5.21%) NoSQL
1 11 (5.21%) SQL Server
2 5 (2.37%) Enterprise Data Warehouse
2 5 (2.37%) MongoDB
2 5 (2.37%) PostgreSQL
3 4 (1.90%) MySQL
4 3 (1.42%) Apache Cassandra
4 3 (1.42%) Elasticsearch
4 3 (1.42%) Relational Database
5 2 (0.95%) Oracle Database
5 2 (0.95%) RDBMS
6 1 (0.47%) Azure SQL Database
6 1 (0.47%) Big Data
6 1 (0.47%) Data Lake
6 1 (0.47%) Data Warehouse
6 1 (0.47%) Power BI
6 1 (0.47%) Spotfire
Development Applications
1 33 (15.64%) JIRA
2 30 (14.22%) Git
3 21 (9.95%) Jenkins
4 17 (8.06%) GitLab
5 9 (4.27%) JMeter
6 8 (3.79%) Robot Framework
7 7 (3.32%) Bitbucket
8 5 (2.37%) Maven
8 5 (2.37%) Zephyr
9 4 (1.90%) Gatling
9 4 (1.90%) Selenium
10 3 (1.42%) JUnit
10 3 (1.42%) webpack
11 1 (0.47%) Cucumber
11 1 (0.47%) gulp
General
1 59 (27.96%) Social Skills
2 48 (22.75%) Finance
3 31 (14.69%) Analytical Skills
4 24 (11.37%) Games
4 24 (11.37%) Manufacturing
5 20 (9.48%) Law
5 20 (9.48%) Public Sector
6 19 (9.00%) Retail
7 16 (7.58%) Electronics
8 13 (6.16%) Tech for Good
9 12 (5.69%) Legal
10 10 (4.74%) Inclusion and Diversity
10 10 (4.74%) Marketing
11 9 (4.27%) Telecoms
12 6 (2.84%) Banking
13 5 (2.37%) Aerospace
13 5 (2.37%) Billing
14 3 (1.42%) Advertising
15 1 (0.47%) Front Office
15 1 (0.47%) Publishing
Job Titles
1 39 (18.48%) Cloud Engineer
2 35 (16.59%) Senior
3 27 (12.80%) Developer
4 25 (11.85%) Platform Engineer
5 24 (11.37%) Azure Engineer
6 21 (9.95%) DevOps Engineer
7 20 (9.48%) Software Engineer
7 20 (9.48%) Support Engineer
8 19 (9.00%) Systems Engineer
9 18 (8.53%) Infrastructure Engineer
9 18 (8.53%) Operations Engineer
10 17 (8.06%) Site Reliability Engineer
11 16 (7.58%) Administrator
12 14 (6.64%) Automation Engineer
12 14 (6.64%) AWS Engineer
12 14 (6.64%) Linux Engineer
12 14 (6.64%) Network Administrator
12 14 (6.64%) Senior Network Administrator
13 13 (6.16%) Cloud Platform Engineer
13 13 (6.16%) Kubernetes Engineer
Libraries, Frameworks & Software Standards
1 20 (9.48%) HTML
2 17 (8.06%) REST
3 15 (7.11%) .NET
3 15 (7.11%) React
4 13 (6.16%) CSS
5 12 (5.69%) RESTful
6 11 (5.21%) ARM Templates
7 10 (4.74%) JSON
7 10 (4.74%) Node.js
8 8 (3.79%) XML
9 7 (3.32%) HTML5
9 7 (3.32%) Sass
10 6 (2.84%) gRPC
10 6 (2.84%) OAuth
11 5 (2.37%) Laravel
11 5 (2.37%) OpenAPI
11 5 (2.37%) Oracle Fusion
11 5 (2.37%) Swagger
11 5 (2.37%) Web Services
12 4 (1.90%) .NET Framework
Miscellaneous
1 19 (9.00%) Hybrid Cloud
2 17 (8.06%) Public Cloud
3 12 (5.69%) Algorithms
3 12 (5.69%) Data Centre
4 10 (4.74%) Enterprise Software
5 9 (4.27%) Self-Motivation
6 7 (3.32%) Client/Server
6 7 (3.32%) Molecular Biology
7 6 (2.84%) Mobile Games
8 5 (2.37%) FMCG
8 5 (2.37%) PKI
9 4 (1.90%) Blog
9 4 (1.90%) CUDA
9 4 (1.90%) Distributed Systems
9 4 (1.90%) Management Information System
9 4 (1.90%) Onboarding
10 3 (1.42%) Cyberattack
10 3 (1.42%) Grid Computing
11 2 (0.95%) Clustering
11 2 (0.95%) Derivative
Operating Systems
1 193 (91.47%) Linux
2 44 (20.85%) Windows
3 37 (17.54%) Unix
4 26 (12.32%) Red Hat Enterprise Linux
5 19 (9.00%) Windows Server
6 13 (6.16%) Debian
7 8 (3.79%) Ubuntu
8 7 (3.32%) Android
9 5 (2.37%) Oracle Linux
10 3 (1.42%) CentOS
10 3 (1.42%) Rocky
10 3 (1.42%) Windows 10
10 3 (1.42%) Windows Server 2016
11 2 (0.95%) Data ONTAP
11 2 (0.95%) Embedded Linux
11 2 (0.95%) Fedora
11 2 (0.95%) openSUSE
11 2 (0.95%) VMS
11 2 (0.95%) Windows Server 2019
12 1 (0.47%) Apple iOS
Processes & Methodologies
1 79 (37.44%) CI/CD
2 68 (32.23%) DevOps
3 57 (27.01%) Agile
3 57 (27.01%) Problem-Solving
4 48 (22.75%) Infrastructure as Code
5 46 (21.80%) Continuous Improvement
6 43 (20.38%) Software Engineering
7 35 (16.59%) Software Testing
8 32 (15.17%) Analytics
8 32 (15.17%) Infrastructure Engineering
9 31 (14.69%) Customer Service
10 29 (13.74%) Change Management
10 29 (13.74%) Mentoring
11 25 (11.85%) Containerisation
12 23 (10.90%) Incident Management
13 22 (10.43%) Coaching
13 22 (10.43%) Machine Learning
13 22 (10.43%) Test Automation
14 21 (9.95%) Configuration Management
14 21 (9.95%) Site Reliability Engineering
Programming Languages
1 106 (50.24%) Python
2 57 (27.01%) Bash
3 55 (26.07%) Java
3 55 (26.07%) SQL
4 42 (19.91%) PowerShell
5 33 (15.64%) C++
6 22 (10.43%) C
7 20 (9.48%) JavaScript
8 18 (8.53%) Perl
9 10 (4.74%) PL/SQL
10 9 (4.27%) Rust
10 9 (4.27%) TypeScript
11 7 (3.32%) PHP
12 6 (2.84%) C#
12 6 (2.84%) Tcl
13 5 (2.37%) Groovy
14 4 (1.90%) Go
15 3 (1.42%) Fortran
15 3 (1.42%) Julia
15 3 (1.42%) R
Qualifications
1 44 (20.85%) Degree
2 31 (14.69%) Security Cleared
3 26 (12.32%) Azure Certification
4 11 (5.21%) DV Cleared
5 8 (3.79%) Master's Degree
5 8 (3.79%) PhD
6 6 (2.84%) Computer Science Degree
7 5 (2.37%) AWS Certification
7 5 (2.37%) Cisco Certification
7 5 (2.37%) Oracle Certification
8 4 (1.90%) AWS Certified Solutions Architect
8 4 (1.90%) CCNP
8 4 (1.90%) SC Cleared
9 3 (1.42%) AWS Certified Cloud Practitioner
9 3 (1.42%) AWS Certified Developer
9 3 (1.42%) BPSS Clearance
9 3 (1.42%) DBS Check
9 3 (1.42%) VMware Certified Professional (VCP)
10 2 (0.95%) RHCSA
10 2 (0.95%) VCAP
Quality Assurance & Compliance
1 8 (3.79%) GDPR
2 6 (2.84%) HIPAA
3 4 (1.90%) SOC 2
4 2 (0.95%) ISO/IEC 27001
5 1 (0.47%) ISO/IEC 27002 (supersedes ISO/IEC 17799)
5 1 (0.47%) JTAG
5 1 (0.47%) NIST
5 1 (0.47%) QA
5 1 (0.47%) SLA
System Software
1 45 (21.33%) Docker
2 27 (12.80%) Active Directory
3 10 (4.74%) VMware Infrastructure
4 9 (4.27%) Virtual Machines
5 7 (3.32%) VMware ESXi
6 4 (1.90%) Firmware
6 4 (1.90%) vSphere
7 3 (1.42%) Slurm Workload Manager
8 2 (0.95%) Hyper-V
8 2 (0.95%) NFS
8 2 (0.95%) Samba
8 2 (0.95%) VMware NSX
9 1 (0.47%) Embedded Firmware
9 1 (0.47%) Virtual Desktop
Systems Management
1 62 (29.38%) Terraform
2 55 (26.07%) Ansible
3 49 (23.22%) Kubernetes
4 27 (12.80%) Puppet
5 24 (11.37%) Progress Chef
6 17 (8.06%) Salt
7 9 (4.27%) Nagios
8 5 (2.37%) Active Directory Federation Services
8 5 (2.37%) Single Sign-On
9 4 (1.90%) vCenter Server
10 3 (1.42%) Kibana
10 3 (1.42%) logstash
10 3 (1.42%) PowerCLI
11 2 (0.95%) Docker Swarm
11 2 (0.95%) Failover Clustering
11 2 (0.95%) Red Hat Satellite
12 1 (0.47%) Grafana
12 1 (0.47%) Prometheus
12 1 (0.47%) Rancher
12 1 (0.47%) SCOrch
Vendors
1 37 (17.54%) Microsoft
2 27 (12.80%) Oracle
3 18 (8.53%) VMware
4 12 (5.69%) Cisco
4 12 (5.69%) Remedy
5 11 (5.21%) BMC
6 10 (4.74%) ServiceNow
7 9 (4.27%) Red Hat
7 9 (4.27%) SAP
8 8 (3.79%) Google
8 8 (3.79%) Progress
9 6 (2.84%) Cadence
10 5 (2.37%) Hyperion
10 5 (2.37%) JD Edwards
10 5 (2.37%) PeopleSoft
10 5 (2.37%) Salesforce
11 4 (1.90%) Atlassian
11 4 (1.90%) CyberArk
11 4 (1.90%) Mellanox
11 4 (1.90%) NVIDIA