Kubernetes Jobs

Kubernetes (k8s)
UK

The table below provides summary statistics for permanent job vacancies requiring Kubernetes skills. It includes a benchmarking guide to the annual salaries offered in vacancies that cited Kubernetes over the 6 months leading up to 23 October 2024, comparing them to the same period in the previous two years.

6 months to
23 Oct 2024
Same period 2023 Same period 2022
Rank 54 37 30
Rank change year-on-year -17 -7 -4
Permanent jobs citing Kubernetes 2,844 3,719 11,891
As % of all permanent jobs advertised in the UK 3.76% 6.26% 8.46%
As % of the Systems Management category 40.55% 41.53% 50.76%
Number of salaries quoted 1,557 2,851 5,829
10th Percentile £48,750 £50,000 £46,250
25th Percentile £60,000 £60,000 £57,500
Median annual salary (50th Percentile) £77,500 £75,000 £77,500
Median % change year-on-year +3.33% -3.23% +6.90%
75th Percentile £97,500 £91,934 £93,750
90th Percentile £115,000 £112,500 £110,250
UK excluding London median annual salary £67,500 £69,447 £68,070
% change year-on-year -2.80% +2.02% +13.45%

All Systems Management Skills
UK

Kubernetes falls under the Systems Management category. For comparison with the information above, the following table provides summary statistics for all permanent job vacancies requiring systems management skills.

Permanent vacancies with a requirement for systems management skills 7,013 8,955 23,426
As % of all permanent jobs advertised in the UK 9.27% 15.06% 16.67%
Number of salaries quoted 3,963 6,883 12,170
10th Percentile £37,500 £35,500 £36,500
25th Percentile £48,925 £47,500 £47,500
Median annual salary (50th Percentile) £67,500 £65,000 £67,500
Median % change year-on-year +3.85% -3.70% +3.85%
75th Percentile £86,250 £84,056 £87,500
90th Percentile £102,500 £100,000 £105,000
UK excluding London median annual salary £57,500 £57,500 £55,000
% change year-on-year - +4.55% -

Kubernetes
Job Vacancy Trend

Job postings citing Kubernetes as a proportion of all IT jobs advertised.
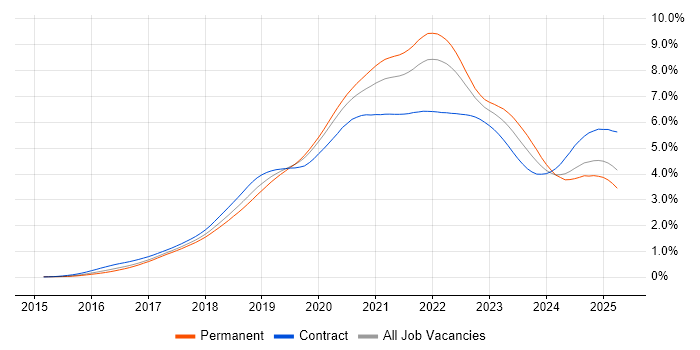
Job vacancy trend for Kubernetes in the UK

Kubernetes
Salary Trend

3-month moving average salary quoted in jobs citing Kubernetes.

Salary trend for Kubernetes in the UK

Kubernetes
Salary Histogram

Salary distribution for jobs citing Kubernetes over the 6 months to 23 October 2024.

Salary histogram for Kubernetes in the UK

Kubernetes
Top 17 Job Locations

The table below looks at the demand and provides a guide to the median salaries quoted in IT jobs citing Kubernetes within the UK over the 6 months to 23 October 2024. The 'Rank Change' column provides an indication of the change in demand within each location based on the same 6 month period last year.

Location Rank Change
on Same Period
Last Year
Matching
Permanent
IT Job Ads
Median Salary
Past 6 Months
Median Salary
% Change
on Same Period
Last Year
Live
Jobs
England -19 2,671 £77,500 +3.33% 765
UK excluding London -35 1,521 £67,500 -2.80% 438
London -3 1,262 £92,500 +8.82% 344
Work from Home -14 1,187 £75,000 +0.67% 1,525
South East +13 549 £67,500 -6.90% 108
North of England -51 321 £63,000 -9.28% 90
South West -23 281 £72,500 +11.54% 114
North West -60 194 £62,500 -12.63% 54
Midlands -48 150 £60,000 -4.00% 40
Scotland -42 109 £70,000 -0.41% 24
Yorkshire -40 106 £65,000 -0.54% 27
East of England -37 104 £72,500 -9.38% 49
West Midlands -37 88 £65,000 +7.88% 23
East Midlands -45 62 £41,500 -33.60% 17
Wales +2 24 £65,000 +13.04% 9
North East -30 21 £69,308 +6.63% 10
Northern Ireland +2 7 £64,654 -13.80% 11

Kubernetes
Co-occurring Skills and Capabilities by Category

The follow tables expand on the table above by listing co-occurrences grouped by category. The same employment type, locality and period is covered with up to 20 co-occurrences shown in each of the following categories:

Application Platforms
1 80 (2.81%) Apache
2 76 (2.67%) Apache Spark
3 59 (2.07%) nginx
4 56 (1.97%) Confluence
5 48 (1.69%) Apache Airflow
6 41 (1.44%) OpenStack
7 22 (0.77%) Microsoft Exchange
8 20 (0.70%) Tomcat
9 17 (0.60%) Jupyter
10 15 (0.53%) CloudStack
11 13 (0.46%) IIS
12 8 (0.28%) Apache Pulsar
12 8 (0.28%) JBoss
13 6 (0.21%) Cloud Foundry
13 6 (0.21%) Red Hat Fuse
13 6 (0.21%) SharePoint
13 6 (0.21%) Solana
14 5 (0.18%) FileNet
14 5 (0.18%) WordPress
15 3 (0.11%) CMS
Applications
1 14 (0.49%) Microsoft Excel
2 4 (0.14%) Chatbot
3 2 (0.070%) Microsoft Office
4 1 (0.035%) Spreadsheet
Business Applications
1 30 (1.05%) Ripple
2 16 (0.56%) Payment Gateway
3 6 (0.21%) Sparx Enterprise Architect
4 2 (0.070%) Dynamics CRM
5 1 (0.035%) Oracle EBS
5 1 (0.035%) Remedy ITSM
5 1 (0.035%) Salesforce CRM
5 1 (0.035%) SAP S/4HANA
Cloud Services
1 1,616 (56.82%) AWS
2 1,113 (39.14%) Azure
3 580 (20.39%) GCP
4 421 (14.80%) GitHub
4 421 (14.80%) Serverless
5 386 (13.57%) Amazon S3
6 300 (10.55%) AWS Lambda
7 239 (8.40%) Azure DevOps
8 230 (8.09%) Amazon SQS
9 205 (7.21%) Amazon Kinesis
10 180 (6.33%) SaaS
11 159 (5.59%) GitHub Actions
12 157 (5.52%) Cloud Computing
12 157 (5.52%) PaaS
13 154 (5.41%) Amazon EKS
14 140 (4.92%) OpenShift
15 134 (4.71%) AWS CloudFormation
16 111 (3.90%) Azure AKS
17 105 (3.69%) Amazon ECS
18 89 (3.13%) Amazon ECR
Communications & Networking
1 179 (6.29%) Broadband
2 119 (4.18%) Firewall
3 104 (3.66%) Network Security
4 63 (2.22%) DNS
5 50 (1.76%) TCP/IP
6 39 (1.37%) HTTP
7 35 (1.23%) DHCP
8 28 (0.98%) Internet
9 17 (0.60%) VPN
10 14 (0.49%) WAN
11 13 (0.46%) SSL
12 11 (0.39%) SD-WAN
13 9 (0.32%) SAN
13 9 (0.32%) VSAN
14 8 (0.28%) MQTT
15 7 (0.25%) AMQP
15 7 (0.25%) iSCSI
15 7 (0.25%) OSPF
16 6 (0.21%) BGP
16 6 (0.21%) MPLS
Database & Business Intelligence
1 446 (15.68%) PostgreSQL
2 270 (9.49%) Redis
3 241 (8.47%) MongoDB
4 235 (8.26%) NoSQL
5 232 (8.16%) DynamoDB
6 190 (6.68%) MySQL
7 182 (6.40%) Relational Database
8 161 (5.66%) Amazon RDS
9 125 (4.40%) SQL Server
10 86 (3.02%) Big Data
11 76 (2.67%) Elasticsearch
12 55 (1.93%) Azure SQL Database
13 38 (1.34%) Hadoop
14 37 (1.30%) Data Lake
15 36 (1.27%) Amazon Redshift
16 29 (1.02%) Amazon Athena
17 27 (0.95%) Data Warehouse
18 26 (0.91%) Amazon Aurora
19 24 (0.84%) Apache Arrow
19 24 (0.84%) Dremio
Development Applications
1 545 (19.16%) Jenkins
2 434 (15.26%) Git
3 276 (9.70%) GitLab
4 106 (3.73%) JIRA
5 104 (3.66%) Selenium
6 78 (2.74%) CircleCI
7 75 (2.64%) Maven
8 70 (2.46%) SonarQube
9 54 (1.90%) Cypress.io
10 47 (1.65%) JUnit
11 39 (1.37%) Bitbucket
11 39 (1.37%) Mockito
12 38 (1.34%) Cucumber
13 36 (1.27%) Octopus Deploy
13 36 (1.27%) TeamCity
14 34 (1.20%) Sonatype Nexus
15 33 (1.16%) Gradle
16 24 (0.84%) PHPUnit
17 23 (0.81%) Artifactory
17 23 (0.81%) SoapUI
General
1 480 (16.88%) Finance
2 432 (15.19%) Social Skills
3 359 (12.62%) Inclusion and Diversity
4 246 (8.65%) Marketing
5 226 (7.95%) Public Sector
6 201 (7.07%) Advertising
7 126 (4.43%) Law
8 120 (4.22%) Banking
9 105 (3.69%) Analytical Skills
10 104 (3.66%) Legal
11 64 (2.25%) Organisational Skills
12 62 (2.18%) Tech for Good
13 53 (1.86%) Retail
14 50 (1.76%) Financial Institution
15 43 (1.51%) Games
16 40 (1.41%) Aerospace
17 34 (1.20%) Front Office
18 30 (1.05%) Telecoms
19 18 (0.63%) Automotive
19 18 (0.63%) Influencing Skills
Job Titles
1 790 (27.78%) Senior
2 624 (21.94%) Software Engineer
3 488 (17.16%) Developer
4 429 (15.08%) DevOps Engineer
5 312 (10.97%) Lead
6 223 (7.84%) Cloud Engineer
7 186 (6.54%) Senior Software Engineer
8 184 (6.47%) Senior Developer
9 157 (5.52%) Java Developer
10 152 (5.34%) Architect
11 138 (4.85%) Senior DevOps
12 136 (4.78%) AWS Engineer
13 132 (4.64%) Senior DevOps Engineer
14 130 (4.57%) Azure Engineer
15 115 (4.04%) Platform Engineer
16 106 (3.73%) Infrastructure Engineer
17 98 (3.45%) Product Manager
18 95 (3.34%) Technical Manager
18 95 (3.34%) Technical Product Manager
19 88 (3.09%) Java Engineer
Libraries, Frameworks & Software Standards
1 681 (23.95%) React
2 351 (12.34%) REST
3 349 (12.27%) AngularJS
4 344 (12.10%) Node.js
5 280 (9.85%) .NET
6 244 (8.58%) Spring
7 220 (7.74%) Kafka
8 207 (7.28%) Tailwind CSS
9 195 (6.86%) Spring Boot
10 184 (6.47%) RESTful
11 141 (4.96%) RabbitMQ
12 120 (4.22%) CSS
12 120 (4.22%) HTML
13 84 (2.95%) GraphQL
14 78 (2.74%) ARM Templates
15 74 (2.60%) .NET Core
16 72 (2.53%) Elastic Stack
17 68 (2.39%) Django
18 66 (2.32%) OAuth
18 66 (2.32%) Web Services
Miscellaneous
1 404 (14.21%) Cloud Native
2 246 (8.65%) Distributed Systems
3 208 (7.31%) Blog
4 196 (6.89%) Digital Media
5 183 (6.43%) Product Ownership
6 176 (6.19%) Public Cloud
7 156 (5.49%) Hybrid Cloud
8 113 (3.97%) Blockchain
9 85 (2.99%) Cyber Threat
10 69 (2.43%) e-Learning
11 66 (2.32%) Cyberattack
11 66 (2.32%) Social Media
12 60 (2.11%) Algorithms
13 58 (2.04%) Data Centre
14 56 (1.97%) Greenfield Project
15 52 (1.83%) Data Structures
16 49 (1.72%) Linux Command Line
16 49 (1.72%) Onboarding
17 38 (1.34%) Clustering
18 36 (1.27%) Self-Motivation
Operating Systems
1 553 (19.44%) Linux
2 215 (7.56%) Windows
3 93 (3.27%) Red Hat Enterprise Linux
4 64 (2.25%) Windows Server
5 62 (2.18%) Ubuntu
6 48 (1.69%) Unix
7 38 (1.34%) CentOS
8 22 (0.77%) Debian
8 22 (0.77%) VMS
9 20 (0.70%) Android
10 17 (0.60%) Windows Server 2016
11 14 (0.49%) SUSE
12 12 (0.42%) Apple iOS
12 12 (0.42%) Windows Server 2019
13 11 (0.39%) Solaris
14 6 (0.21%) Oracle Linux
15 5 (0.18%) Windows 10
16 4 (0.14%) AIX
16 4 (0.14%) Embedded Linux
16 4 (0.14%) SUSE Linux Enterprise Server
Processes & Methodologies
1 1,288 (45.29%) DevOps
2 1,131 (39.77%) CI/CD
3 1,071 (37.66%) Agile
4 1,031 (36.25%) Software Engineering
5 792 (27.85%) Containerisation
6 668 (23.49%) Microservices
7 614 (21.59%) Infrastructure as Code
8 461 (16.21%) Full-Stack Development
9 451 (15.86%) Mentoring
10 418 (14.70%) Continuous Delivery
11 367 (12.90%) Artificial Intelligence
12 361 (12.69%) Scrum
13 357 (12.55%) Problem-Solving
14 284 (9.99%) Continuous Integration
15 281 (9.88%) Test Automation
16 279 (9.81%) SDLC
17 255 (8.97%) Computer Science
18 253 (8.90%) Machine Learning
19 249 (8.76%) User Experience
20 247 (8.68%) E-Commerce
Programming Languages
1 877 (30.84%) Python
2 674 (23.70%) Java
3 546 (19.20%) TypeScript
4 468 (16.46%) JavaScript
5 336 (11.81%) SQL
6 331 (11.64%) C#
7 246 (8.65%) PowerShell
8 231 (8.12%) Go
9 191 (6.72%) Bash
10 146 (5.13%) Rust
11 119 (4.18%) C++
12 83 (2.92%) C
13 79 (2.78%) PHP
14 58 (2.04%) Kotlin
14 58 (2.04%) Scala
15 54 (1.90%) Perl
16 51 (1.79%) Bicep
17 44 (1.55%) Shell Script
18 36 (1.27%) Ruby
19 31 (1.09%) Solidity
Qualifications
1 404 (14.21%) Security Cleared
2 310 (10.90%) Degree
3 189 (6.65%) SC Cleared
4 149 (5.24%) DV Cleared
5 131 (4.61%) Computer Science Degree
6 72 (2.53%) AWS Certification
7 68 (2.39%) Azure Certification
8 41 (1.44%) Master's Degree
9 34 (1.20%) BPSS Clearance
10 30 (1.05%) AWS Certified Solutions Architect
11 27 (0.95%) Microsoft Certification
12 17 (0.60%) ITIL Foundation Certificate
13 15 (0.53%) Cisco Certification
14 14 (0.49%) TOGAF Certification
15 11 (0.39%) CCIE
16 9 (0.32%) AWS Certified DevOps Engineer
16 9 (0.32%) CCIE Data Center
16 9 (0.32%) RHCA
16 9 (0.32%) VCDX
17 7 (0.25%) PhD
Quality Assurance & Compliance
1 182 (6.40%) QA
2 94 (3.31%) GDPR
3 90 (3.16%) NIST
4 87 (3.06%) ISO/IEC 27001
5 76 (2.67%) HIPAA
6 33 (1.16%) Accessibility
7 32 (1.13%) Data Quality
8 25 (0.88%) WCAG
9 22 (0.77%) SOC 2
10 20 (0.70%) NCSC
11 15 (0.53%) PCI DSS
12 12 (0.42%) ISO 9001
13 8 (0.28%) SLA
14 4 (0.14%) Cyber Essentials
15 3 (0.11%) MiFID
16 2 (0.070%) ISO 13485
16 2 (0.070%) Sarbanes-Oxley
17 1 (0.035%) HL7
17 1 (0.035%) ISO 15022
17 1 (0.035%) ISO 20022
System Software
1 1,899 (66.77%) Docker
2 93 (3.27%) Active Directory
3 89 (3.13%) VMware Infrastructure
4 66 (2.32%) Virtual Machines
5 28 (0.98%) vSphere
6 25 (0.88%) Hyper-V
7 18 (0.63%) pfSense
7 18 (0.63%) Virtual Desktop
8 14 (0.49%) VMware ESXi
9 10 (0.35%) Ceph
9 10 (0.35%) VMware NSX
10 7 (0.25%) KVM
10 7 (0.25%) NFS
10 7 (0.25%) Slurm Workload Manager
11 5 (0.18%) HDFS
11 5 (0.18%) Virtual Servers
12 4 (0.14%) Firmware
12 4 (0.14%) Lustre
13 3 (0.11%) GPFS
14 2 (0.070%) LXC
Systems Management
1 1,021 (35.90%) Terraform
2 440 (15.47%) Ansible
3 230 (8.09%) Prometheus
4 159 (5.59%) Grafana
5 119 (4.18%) Puppet
6 59 (2.07%) Progress Chef
7 40 (1.41%) Argo
8 39 (1.37%) Istio
9 28 (0.98%) Kibana
10 27 (0.95%) Active Directory Federation Services
11 25 (0.88%) Packer
12 20 (0.70%) SCCM
13 17 (0.60%) Microsoft Intune
13 17 (0.60%) Salt
14 16 (0.56%) vCenter Server
15 15 (0.53%) HAProxy
15 15 (0.53%) Rancher
16 14 (0.49%) Nagios
17 13 (0.46%) Single Sign-On
18 12 (0.42%) SCOM
Vendors
1 225 (7.91%) Microsoft
2 187 (6.58%) Google
3 183 (6.43%) Red Hat
4 133 (4.68%) VMware
5 72 (2.53%) Oracle
6 71 (2.50%) Dynatrace
7 68 (2.39%) IBM
8 54 (1.90%) Splunk
9 36 (1.27%) Atlassian
10 32 (1.13%) ServiceNow
11 31 (1.09%) Databricks
12 30 (1.05%) OpenAI
13 27 (0.95%) Cisco
14 14 (0.49%) Citrix
15 12 (0.42%) Black Duck
16 11 (0.39%) New Relic
16 11 (0.39%) SAP
17 10 (0.35%) AppDynamics
18 9 (0.32%) ForgeRock
18 9 (0.32%) HP