CI/CD
UK

The table below provides summary statistics for permanent job vacancies requiring CI/CD skills. It includes a benchmarking guide to the annual salaries offered in vacancies that cited CI/CD over the 6 months leading up to 26 July 2024, comparing them to the same period in the previous two years.

6 months to
26 Jul 2024
Same period 2023 Same period 2022
Rank 34 25 17
Rank change year-on-year -9 -8 +4
Permanent jobs citing CI/CD 4,823 6,585 21,807
As % of all permanent jobs advertised in the UK 5.34% 8.16% 12.44%
As % of the Processes & Methodologies category 6.52% 8.56% 12.91%
Number of salaries quoted 2,642 4,561 8,159
10th Percentile £46,250 £47,500 £46,250
25th Percentile £55,000 £57,500 £55,500
Median annual salary (50th Percentile) £70,000 £75,000 £72,500
Median % change year-on-year -6.67% +3.45% +7.41%
75th Percentile £87,500 £91,250 £90,000
90th Percentile £100,000 £110,000 £105,000
UK excluding London median annual salary £65,000 £65,000 £65,000
% change year-on-year - - +8.33%

All Process and Methodology Skills
UK

CI/CD falls under the Processes and Methodologies category. For comparison with the information above, the following table provides summary statistics for all permanent job vacancies requiring process or methodology skills.

Permanent vacancies with a requirement for process or methodology skills 73,969 76,929 168,958
As % of all permanent jobs advertised in the UK 81.84% 95.34% 96.40%
Number of salaries quoted 48,628 50,249 85,709
10th Percentile £30,000 £33,750 £33,750
25th Percentile £40,000 £45,000 £44,250
Median annual salary (50th Percentile) £55,000 £60,000 £60,000
Median % change year-on-year -8.33% - +9.09%
75th Percentile £73,750 £80,000 £80,000
90th Percentile £93,750 £100,000 £96,250
UK excluding London median annual salary £50,000 £55,000 £52,500
% change year-on-year -9.09% +4.76% +6.06%

CI/CD
Job Vacancy Trend

Job postings citing CI/CD as a proportion of all IT jobs advertised.
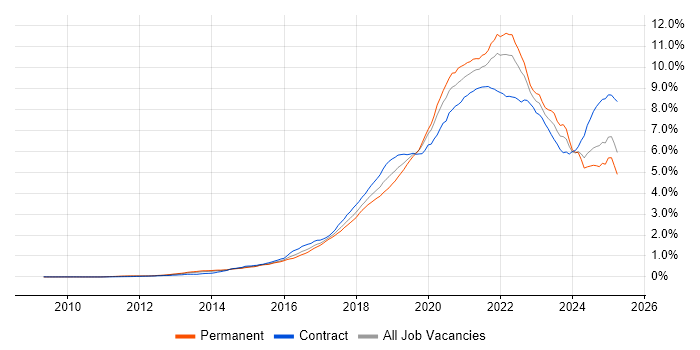
Job vacancy trend for CI/CD in the UK

CI/CD
Salary Trend

3-month moving average salary quoted in jobs citing CI/CD.

Salary trend for CI/CD in the UK

CI/CD
Salary Histogram

Salary distribution for jobs citing CI/CD over the 6 months to 26 July 2024.

Salary histogram for CI/CD in the UK

CI/CD
Top 18 Job Locations

The table below looks at the demand and provides a guide to the median salaries quoted in IT jobs citing CI/CD within the UK over the 6 months to 26 July 2024. The 'Rank Change' column provides an indication of the change in demand within each location based on the same 6 month period last year.

Location Rank Change
on Same Period
Last Year
Matching
Permanent
IT Job Ads
Median Salary
Past 6 Months
Median Salary
% Change
on Same Period
Last Year
Live
Jobs
UK excluding London +3 3,342 £65,000 - 403
England -26 3,157 £70,000 -6.67% 474
Work from Home -20 1,504 £67,500 -10.00% 360
Scotland +37 1,441 £70,000 +0.80% 37
London -15 1,249 £85,000 +3.03% 183
North of England -28 602 £62,783 -7.03% 90
South East -30 507 £64,000 -5.19% 73
South West -7 379 £65,000 - 61
North West -21 346 £65,000 -7.14% 57
Midlands -40 271 £62,500 - 61
Yorkshire -20 207 £60,000 -7.69% 22
West Midlands -33 164 £67,500 +3.85% 51
East Midlands -32 105 £57,500 - 10
East of England -51 78 £62,500 -7.41% 24
Wales -16 50 £55,000 -4.35% 9
North East -20 49 £62,783 +4.64% 11
Northern Ireland -28 13 £63,150 +26.30% 56
Isle of Man - 3 - -

CI/CD
Co-occurring Skills and Capabilities by Category

The follow tables expand on the table above by listing co-occurrences grouped by category. The same employment type, locality and period is covered with up to 20 co-occurrences shown in each of the following categories:

Application Platforms
1 405 (8.40%) Apache Spark
2 161 (3.34%) Apache
3 127 (2.63%) Apache Airflow
4 98 (2.03%) FileNet
5 76 (1.58%) Confluence
6 55 (1.14%) nginx
7 53 (1.10%) SharePoint
8 27 (0.56%) IIS
9 25 (0.52%) Microsoft Exchange
10 24 (0.50%) OpenStack
11 23 (0.48%) CMS
12 21 (0.44%) GemFire
13 19 (0.39%) Cloud Foundry
14 16 (0.33%) Jupyter
15 14 (0.29%) Umbraco
16 11 (0.23%) CICS
17 10 (0.21%) Tomcat
18 8 (0.17%) JBoss
19 7 (0.15%) SAS
20 4 (0.083%) WordPress
Applications
1 24 (0.50%) Microsoft Office
2 9 (0.19%) Microsoft Excel
3 7 (0.15%) Microsoft Project
3 7 (0.15%) MS Visio
4 6 (0.12%) Photoshop
5 3 (0.062%) S-PLUS
6 2 (0.041%) Microsoft PowerPoint
6 2 (0.041%) Notion
6 2 (0.041%) Trello
7 1 (0.021%) Blender
7 1 (0.021%) Chatbot
Business Applications
1 62 (1.29%) Dynamics CRM
2 12 (0.25%) Remedy ITSM
3 8 (0.17%) SAP S/4HANA
4 4 (0.083%) Oracle Applications
5 2 (0.041%) Adaptiv
5 2 (0.041%) Dynamics NAV
5 2 (0.041%) Salesforce CRM
5 2 (0.041%) Shopify
5 2 (0.041%) Sparx Enterprise Architect
6 1 (0.021%) Magento
6 1 (0.021%) NetSuite
Cloud Services
1 2,208 (45.78%) AWS
2 1,920 (39.81%) Azure
3 807 (16.73%) Azure DevOps
4 535 (11.09%) GCP
5 409 (8.48%) Serverless
6 401 (8.31%) GitHub
7 280 (5.81%) Amazon S3
8 240 (4.98%) Power Platform
9 214 (4.44%) SaaS
10 207 (4.29%) AWS Lambda
11 187 (3.88%) GitHub Actions
12 170 (3.52%) Amazon EC2
13 155 (3.21%) AWS CloudFormation
14 150 (3.11%) Datadog
15 140 (2.90%) Dynamics 365
16 139 (2.88%) Cloud Computing
17 134 (2.78%) PaaS
18 128 (2.65%) Amazon EKS
19 126 (2.61%) Azure Data Factory
20 125 (2.59%) Amazon ECS
Communications & Networking
1 110 (2.28%) Firewall
2 77 (1.60%) DNS
3 52 (1.08%) VPN
4 49 (1.02%) WAN
5 44 (0.91%) Kerberos
6 42 (0.87%) Network Security
7 36 (0.75%) HTTP
7 36 (0.75%) SD-WAN
8 26 (0.54%) DHCP
9 18 (0.37%) BGP
10 15 (0.31%) MQTT
10 15 (0.31%) SSL
10 15 (0.31%) TCP/IP
11 14 (0.29%) Internet
12 11 (0.23%) Ethernet VPN
12 11 (0.23%) MPLS
13 9 (0.19%) LAN
13 9 (0.19%) VLAN
14 6 (0.12%) Intrusion Detection
14 6 (0.12%) Reverse Proxy
Database & Business Intelligence
1 650 (13.48%) NoSQL
2 351 (7.28%) Big Data
3 332 (6.88%) SQL Server
4 228 (4.73%) Data Warehouse
5 188 (3.90%) Relational Database
6 184 (3.82%) PostgreSQL
7 167 (3.46%) Amazon RDS
8 162 (3.36%) Hadoop
9 159 (3.30%) Elasticsearch
10 150 (3.11%) Apache Cassandra
10 150 (3.11%) MySQL
11 138 (2.86%) MongoDB
12 133 (2.76%) Power BI
13 117 (2.43%) BigQuery
14 110 (2.28%) Data Lake
15 106 (2.20%) Azure SQL Database
16 100 (2.07%) DynamoDB
17 93 (1.93%) Looker
18 90 (1.87%) Metadata
19 88 (1.82%) Apache Hive
Development Applications
1 709 (14.70%) Git
2 699 (14.49%) Jenkins
3 331 (6.86%) GitLab
4 260 (5.39%) JIRA
5 251 (5.20%) JUnit
6 166 (3.44%) Selenium
7 131 (2.72%) Cypress.io
8 105 (2.18%) Jasmine
9 102 (2.11%) CircleCI
10 97 (2.01%) Postman
11 92 (1.91%) Bitbucket
12 91 (1.89%) Cucumber
13 80 (1.66%) WebDriver
14 76 (1.58%) TeamCity
15 70 (1.45%) Artifactory
16 69 (1.43%) Visual Studio
17 64 (1.33%) JMeter
17 64 (1.33%) Protractor
18 61 (1.26%) Bitbucket Server
19 60 (1.24%) Karma Test Runner
General
1 1,915 (39.71%) Finance
2 1,490 (30.89%) Inclusion and Diversity
3 1,384 (28.70%) Law
4 948 (19.66%) Social Skills
5 609 (12.63%) Marketing
6 539 (11.18%) Legal
7 419 (8.69%) Banking
8 292 (6.05%) Analytical Skills
9 265 (5.49%) Public Sector
10 242 (5.02%) Investment Banking
11 147 (3.05%) Retail
12 141 (2.92%) Financial Institution
13 97 (2.01%) Influencing Skills
14 74 (1.53%) Billing
15 67 (1.39%) Aerospace
16 64 (1.33%) Organisational Skills
17 57 (1.18%) Retail Banking
18 46 (0.95%) Telecoms
19 45 (0.93%) Tech for Good
20 44 (0.91%) Games
Job Titles
1 1,548 (32.10%) Software Engineer
2 970 (20.11%) Developer
3 862 (17.87%) Senior
4 850 (17.62%) Lead
5 508 (10.53%) DevOps Engineer
6 502 (10.41%) Java Engineer
7 486 (10.08%) Java Software Engineer
8 430 (8.92%) Lead Software Engineer
9 366 (7.59%) Data Engineer
10 353 (7.32%) AWS Engineer
11 308 (6.39%) Senior Developer
12 264 (5.47%) Cloud Engineer
13 259 (5.37%) Python Engineer
14 258 (5.35%) Architect
15 237 (4.91%) Python Software Engineer
16 229 (4.75%) Big Data Engineer
17 217 (4.50%) Azure Engineer
18 213 (4.42%) Big Data Software Engineer
19 211 (4.37%) Full Stack Engineer
20 207 (4.29%) AWS Software Engineer
Libraries, Frameworks & Software Standards
1 778 (16.13%) React
2 685 (14.20%) .NET
3 568 (11.78%) Spring
4 479 (9.93%) AngularJS
5 435 (9.02%) Node.js
6 417 (8.65%) HTML
7 408 (8.46%) Kafka
8 379 (7.86%) CSS
9 321 (6.66%) RESTful
10 299 (6.20%) REST
11 298 (6.18%) Spring Boot
12 285 (5.91%) JSON
13 240 (4.98%) Web Services
14 237 (4.91%) J2EE
15 233 (4.83%) GraphQL
16 206 (4.27%) Hibernate
17 183 (3.79%) .NET Framework
18 174 (3.61%) .NET Core
19 169 (3.50%) PySpark
20 167 (3.46%) JMS
Miscellaneous
1 723 (14.99%) Cloud Native
2 615 (12.75%) Algorithms
3 257 (5.33%) Product Ownership
4 229 (4.75%) Distributed Systems
5 211 (4.37%) Public Cloud
6 180 (3.73%) Onboarding
7 178 (3.69%) Management Information System
8 140 (2.90%) Data Structures
9 114 (2.36%) Hybrid Cloud
10 92 (1.91%) Mobile App
11 84 (1.74%) Greenfield Project
11 84 (1.74%) Self-Motivation
12 71 (1.47%) Linux Command Line
13 66 (1.37%) Blockchain
14 62 (1.29%) Market Risk
15 58 (1.20%) Enterprise Cloud
16 57 (1.18%) Enterprise Software
16 57 (1.18%) IoT
17 56 (1.16%) Reference Data
18 51 (1.06%) Data Centre
Operating Systems
1 580 (12.03%) Linux
2 205 (4.25%) Windows
3 143 (2.96%) Unix
4 80 (1.66%) Android
5 67 (1.39%) Windows Server
6 57 (1.18%) CentOS
7 50 (1.04%) Apple iOS
8 45 (0.93%) Red Hat Enterprise Linux
9 44 (0.91%) Debian
10 40 (0.83%) Alpine Linux
11 17 (0.35%) Windows Server 2016
11 17 (0.35%) Windows Server 2019
12 15 (0.31%) VMS
13 12 (0.25%) Ubuntu
14 11 (0.23%) Oracle Linux
14 11 (0.23%) Solaris
15 5 (0.10%) Windows 10
16 3 (0.062%) Amazon Linux
16 3 (0.062%) Windows Server 2008
17 2 (0.041%) Mac OS
Processes & Methodologies
1 2,865 (59.40%) Agile
2 2,155 (44.68%) Software Engineering
3 2,139 (44.35%) DevOps
4 1,580 (32.76%) SDLC
5 1,116 (23.14%) Artificial Intelligence
6 1,071 (22.21%) Operational Stability
7 1,053 (21.83%) Machine Learning
8 917 (19.01%) Community of Practice
9 858 (17.79%) Continuous Improvement
10 838 (17.38%) Problem-Solving
11 823 (17.06%) Microservices
12 805 (16.69%) Infrastructure as Code
13 687 (14.24%) Test Automation
14 645 (13.37%) Full Stack Development
15 638 (13.23%) TDD
16 618 (12.81%) Visualisation
17 617 (12.79%) Continuous Integration
18 593 (12.30%) Containerisation
19 590 (12.23%) Continuous Delivery
20 546 (11.32%) Scrum
Programming Languages
1 1,568 (32.51%) Java
2 1,429 (29.63%) Python
3 1,245 (25.81%) SQL
4 817 (16.94%) JavaScript
5 757 (15.70%) C#
6 479 (9.93%) TypeScript
7 359 (7.44%) PowerShell
8 266 (5.52%) Bash
9 242 (5.02%) Scala
10 221 (4.58%) Go
11 140 (2.90%) Kotlin
12 99 (2.05%) Bicep
13 94 (1.95%) PL/SQL
14 91 (1.89%) C++
15 89 (1.85%) PHP
16 88 (1.82%) Shell Script
17 62 (1.29%) Ruby
18 48 (1.00%) Groovy
19 44 (0.91%) Prolog
19 44 (0.91%) SPARQL
Qualifications
1 460 (9.54%) Degree
2 422 (8.75%) Security Cleared
3 276 (5.72%) Computer Science Degree
4 260 (5.39%) SC Cleared
5 191 (3.96%) Azure Certification
6 132 (2.74%) AWS Certification
7 110 (2.28%) DV Cleared
8 104 (2.16%) Master's Degree
9 95 (1.97%) Microsoft Certification
10 56 (1.16%) DBS Check
11 48 (1.00%) CISSP
12 41 (0.85%) MCSA
12 41 (0.85%) MCSE
13 32 (0.66%) BPSS Clearance
13 32 (0.66%) Cisco Certification
13 32 (0.66%) ISTQB
14 27 (0.56%) AWS Certified Solutions Architect
15 26 (0.54%) ITIL Foundation Certificate
16 25 (0.52%) CISM
17 24 (0.50%) (ISC)2 CCSP
Quality Assurance & Compliance
1 364 (7.55%) QA
2 106 (2.20%) Accessibility
3 89 (1.85%) Data Quality
4 49 (1.02%) GDPR
5 41 (0.85%) ISO/IEC 27001
6 38 (0.79%) NIST
7 32 (0.66%) SLA
8 25 (0.52%) PCI DSS
9 20 (0.41%) HIPAA
10 13 (0.27%) SOC 2
11 12 (0.25%) Cyber Essentials
12 11 (0.23%) WCAG
13 8 (0.17%) Sarbanes-Oxley
14 7 (0.15%) NCSC
15 6 (0.12%) ISO 13485
15 6 (0.12%) MiFID
16 5 (0.10%) GRC
16 5 (0.10%) ISO 9001
17 4 (0.083%) EMIR
18 2 (0.041%) PSD2
System Software
1 1,102 (22.85%) Docker
2 143 (2.96%) Active Directory
3 109 (2.26%) Virtual Machines
4 64 (1.33%) HDFS
5 46 (0.95%) Virtual Desktop
6 22 (0.46%) VMware Infrastructure
7 11 (0.23%) Firmware
7 11 (0.23%) Time Sharing Option
8 10 (0.21%) Hyper-V
9 8 (0.17%) Ceph
9 8 (0.17%) VMware ESXi
9 8 (0.17%) vSphere
10 5 (0.10%) KVM
10 5 (0.10%) Virtual Servers
10 5 (0.10%) VMware NSX
11 4 (0.083%) Xen
12 2 (0.041%) Apache ZooKeeper
12 2 (0.041%) Embedded Firmware
12 2 (0.041%) RACF
12 2 (0.041%) Varnish
Systems Management
1 1,371 (28.43%) Kubernetes
2 1,163 (24.11%) Terraform
3 411 (8.52%) Ansible
4 248 (5.14%) Grafana
5 167 (3.46%) Prometheus
6 98 (2.03%) Puppet
7 83 (1.72%) Progress Chef
8 51 (1.06%) Kibana
9 48 (1.00%) Single Sign-On
10 40 (0.83%) Istio
11 39 (0.81%) HAProxy
12 30 (0.62%) Docker Swarm
13 29 (0.60%) Active Directory Federation Services
14 23 (0.48%) Microsoft Intune
15 21 (0.44%) ITRS Geneos
15 21 (0.44%) Zipkin
16 20 (0.41%) Argo
17 19 (0.39%) SCCM
18 18 (0.37%) Salt
19 17 (0.35%) SCOM
Vendors
1 626 (12.98%) Microsoft
2 300 (6.22%) Databricks
2 300 (6.22%) Oracle
3 289 (5.99%) Google
4 208 (4.31%) Splunk
5 170 (3.52%) Dynatrace
6 95 (1.97%) Red Hat
7 72 (1.49%) Informatica
8 70 (1.45%) IBM
9 58 (1.20%) ServiceNow
10 44 (0.91%) VMware
11 42 (0.87%) Atlassian
12 40 (0.83%) Alteryx
13 37 (0.77%) Salesforce
14 35 (0.73%) Cloudera
15 25 (0.52%) CyberArk
16 24 (0.50%) SAP
17 23 (0.48%) Cisco
17 23 (0.48%) OpenAI
18 19 (0.39%) New Relic