High Availability
UK

The following table provides summary statistics for permanent job vacancies with a requirement for High Availability skills. Included is a benchmarking guide to the salaries offered in vacancies that have cited High Availability over the 6 months to 28 November 2023 with a comparison to the same period in the previous 2 years.

6 months to
28 Nov 2023
Same period 2022 Same period 2021
Rank 244 314 298
Rank change year-on-year +70 -16 +3
Permanent jobs citing High Availability 735 1,447 1,582
As % of all permanent jobs advertised in the UK 1.35% 1.15% 1.23%
As % of the Processes & Methodologies category 1.44% 1.20% 1.29%
Number of salaries quoted 614 849 939
10th Percentile £33,500 £35,600 £37,500
25th Percentile £46,350 £48,091 £46,250
Median annual salary (50th Percentile) £60,000 £62,596 £58,000
Median % change year-on-year -4.15% +7.92% -3.33%
75th Percentile £80,000 £85,000 £78,750
90th Percentile £92,500 £97,500 £96,250
UK excluding London median annual salary £52,500 £57,500 £50,000
% change year-on-year -8.70% +15.00% -4.76%

All Process and Methodology Skills
UK

High Availability is in the Processes and Methodologies category. The following table is for comparison with the above and provides summary statistics for all permanent job vacancies with a requirement for process or methodology skills.

Permanent vacancies with a requirement for process or methodology skills 51,121 120,104 122,523
As % of all permanent jobs advertised in the UK 94.09% 95.72% 95.43%
Number of salaries quoted 36,956 73,203 81,032
10th Percentile £32,500 £34,313 £32,500
25th Percentile £43,750 £45,000 £42,500
Median annual salary (50th Percentile) £60,000 £60,000 £59,000
Median % change year-on-year - +1.69% +7.27%
75th Percentile £80,000 £81,250 £77,500
90th Percentile £98,750 £100,000 £95,000
UK excluding London median annual salary £52,500 £53,000 £50,000
% change year-on-year -0.94% +6.00% +4.17%

High Availability
Job Vacancy Trend

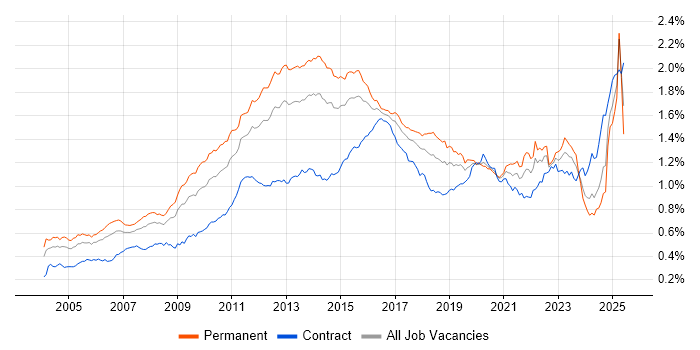
Job postings citing High Availability as a proportion of all IT jobs advertised.

Job vacancy trend for High Availability in the UK

High Availability
Salary Trend

3-month moving average salary quoted in jobs citing High Availability.

Salary trend for High Availability in the UK

High Availability
Salary Histogram

Salary distribution for jobs citing High Availability over the 6 months to 28 November 2023.

Salary histogram for High Availability in the UK

High Availability
Top 18 Job Locations

The table below looks at the demand and provides a guide to the median salaries quoted in IT jobs citing High Availability within the UK over the 6 months to 28 November 2023. The 'Rank Change' column provides an indication of the change in demand within each location based on the same 6 month period last year.

Location Rank Change
on Same Period
Last Year
Matching
Permanent
IT Job Ads
Median Salary
Past 6 Months
Median Salary
% Change
on Same Period
Last Year
Live
Jobs
England +81 622 £60,000 -7.69% 206
UK excluding London +55 419 £52,500 -8.70% 131
Work from Home +8 290 £65,000 +8.33% 112
London +113 262 £77,500 - 106
North of England +72 121 £50,000 -9.09% 41
Midlands +112 91 £42,500 -26.09% 25
South East +97 87 £60,000 - 36
West Midlands +125 72 £42,500 -29.17% 19
Yorkshire +64 59 £34,500 -34.29% 16
North West +66 52 £60,000 +4.35% 22
Scotland -12 49 £52,500 -22.38% 13
South West -28 44 £58,000 +54.67% 10
East Midlands +26 21 £58,750 +8.80% 6
North East +44 10 £39,503 -33.89% 3
Isle of Man - 10 £60,000 -
East of England +84 8 £58,750 -26.56% 7
Wales +3 5 - - 3
Northern Ireland - 4 £75,000 -

High Availability
Co-occurring Skills and Capabilities by Category

The follow tables expand on the table above by listing co-occurrences grouped by category. The same employment type, locality and period is covered with up to 20 co-occurrences shown in each of the following categories:

Application Platforms
1 40 (5.44%) IIS
2 22 (2.99%) SharePoint
3 12 (1.63%) MS Exchange
4 8 (1.09%) Apache Spark
4 8 (1.09%) Confluence
5 6 (0.82%) IBM HTTP Server
5 6 (0.82%) WebSphere
6 4 (0.54%) Oracle HTTP Server
6 4 (0.54%) WebSphere Application Server
7 3 (0.41%) Apache Airflow
7 3 (0.41%) nginx
8 2 (0.27%) Apache
8 2 (0.27%) CMS
8 2 (0.27%) JBoss
8 2 (0.27%) OpenStack
9 1 (0.14%) Drupal
9 1 (0.14%) Ethereum
9 1 (0.14%) Exchange Server 2013
9 1 (0.14%) WebLogic
9 1 (0.14%) WordPress
Applications
1 42 (5.71%) Microsoft Office
Business Applications
1 6 (0.82%) Oracle Cash Management
1 6 (0.82%) SAP Business One
2 1 (0.14%) Magento
2 1 (0.14%) Oracle Procure-to-Pay
2 1 (0.14%) Remedy ITSM
Cloud Services
1 325 (44.22%) Azure
2 246 (33.47%) AWS
3 101 (13.74%) Microsoft 365
4 60 (8.16%) Serverless
5 54 (7.35%) GCP
6 43 (5.85%) Cloud Computing
7 41 (5.58%) PaaS
8 40 (5.44%) IaaS
9 35 (4.76%) SaaS
10 33 (4.49%) Entra ID
11 29 (3.95%) Azure DevOps
12 28 (3.81%) Power Platform
13 27 (3.67%) OpenShift
14 26 (3.54%) AWS CloudFormation
14 26 (3.54%) AWS Lambda
15 25 (3.40%) GitHub
16 24 (3.27%) Amazon S3
17 16 (2.18%) Azure Data Factory
18 15 (2.04%) Amazon EC2
19 14 (1.90%) Amazon EKS
Communications & Networking
1 105 (14.29%) WAN
2 92 (12.52%) DNS
3 77 (10.48%) DHCP
4 76 (10.34%) Firewall
5 74 (10.07%) VPN
6 65 (8.84%) LAN
7 63 (8.57%) Wireless
8 62 (8.44%) SAN
9 36 (4.90%) Internet
10 33 (4.49%) Network Security
11 25 (3.40%) Structured Cabling
12 23 (3.13%) SSL
13 20 (2.72%) HTTP
13 20 (2.72%) Wi-Fi
14 17 (2.31%) TCP/IP
15 16 (2.18%) BGP
16 15 (2.04%) Cisco Nexus
17 14 (1.90%) WLAN
18 13 (1.77%) OSPF
19 10 (1.36%) Cisco IOS
Database & Business Intelligence
1 133 (18.10%) SQL Server
2 77 (10.48%) Amazon RDS
3 54 (7.35%) Oracle Database
4 47 (6.39%) NoSQL
5 33 (4.49%) Azure SQL Database
6 29 (3.95%) Oracle Database 12c
7 28 (3.81%) Power BI
8 26 (3.54%) Relational Database
9 25 (3.40%) SQL Server Reporting Services
10 21 (2.86%) Amazon Redshift
10 21 (2.86%) Data Warehouse
10 21 (2.86%) MySQL
10 21 (2.86%) Oracle Database 10g
10 21 (2.86%) Oracle Database 11g
11 19 (2.59%) Elasticsearch
11 19 (2.59%) SQL Server Integration Services
12 18 (2.45%) PostgreSQL
13 17 (2.31%) DynamoDB
14 16 (2.18%) Big Data
15 12 (1.63%) Amazon Athena
Development Applications
1 76 (10.34%) Jenkins
2 46 (6.26%) JIRA
3 45 (6.12%) Git
4 36 (4.90%) GitLab
5 16 (2.18%) CircleCI
6 14 (1.90%) Selenium
7 12 (1.63%) git-flow
8 9 (1.22%) Maven
9 8 (1.09%) Bitbucket
9 8 (1.09%) JMeter
9 8 (1.09%) SoapUI
9 8 (1.09%) TestLink
10 7 (0.95%) TeamCity
11 4 (0.54%) Postman
11 4 (0.54%) SQL Server Management Studio (SSMS)
12 3 (0.41%) NUnit
12 3 (0.41%) Subversion
13 2 (0.27%) IBM UrbanCode
13 2 (0.27%) Oracle Forms
13 2 (0.27%) Sonatype Nexus
General
1 281 (38.23%) Social Skills
2 188 (25.58%) Finance
3 107 (14.56%) Analytical Skills
4 47 (6.39%) Banking
5 44 (5.99%) Telecoms
6 33 (4.49%) Games
7 19 (2.59%) Inclusion and Diversity
8 13 (1.77%) Documentation Skills
9 11 (1.50%) Organisational Skills
10 10 (1.36%) Retail
11 9 (1.22%) Public Sector
12 7 (0.95%) Aerospace
12 7 (0.95%) Financial Institution
13 6 (0.82%) Law
14 5 (0.68%) Billing
14 5 (0.68%) Health Technology
15 4 (0.54%) Front Office
15 4 (0.54%) Presentation Skills
16 3 (0.41%) Local Government
16 3 (0.41%) Police
Job Titles
1 117 (15.92%) Senior
2 93 (12.65%) DBA
3 86 (11.70%) Developer
4 79 (10.75%) Administrator
5 70 (9.52%) Infrastructure Engineer
6 69 (9.39%) Architect
7 63 (8.57%) DevOps Engineer
8 58 (7.89%) Systems Engineer
9 40 (5.44%) SQL DBA
10 36 (4.90%) Support Engineer
11 34 (4.63%) Java Developer
12 33 (4.49%) Lead
12 33 (4.49%) Senior Developer
13 32 (4.35%) Azure Engineer
13 32 (4.35%) Network Engineer
14 28 (3.81%) AWS Engineer
14 28 (3.81%) Software Engineer
15 27 (3.67%) Technical Architect
16 26 (3.54%) AWS DevOps
17 24 (3.27%) AWS DevOps Engineer
Libraries, Frameworks & Software Standards
1 75 (10.20%) REST
2 43 (5.85%) Kafka
3 33 (4.49%) Node.js
4 29 (3.95%) .NET
4 29 (3.95%) React
5 26 (3.54%) Spring
6 24 (3.27%) LDAP
7 22 (2.99%) Web Services
8 20 (2.72%) HTML
9 19 (2.59%) WebRTC
10 18 (2.45%) JSON
10 18 (2.45%) RESTful
11 17 (2.31%) AngularJS
11 17 (2.31%) OAuth
12 16 (2.18%) Middleware
12 16 (2.18%) SAML
13 15 (2.04%) OpenID
14 14 (1.90%) YAML
15 13 (1.77%) Spring Boot
16 12 (1.63%) .NET Core
Miscellaneous
1 105 (14.29%) Data Centre
2 94 (12.79%) Clustering
3 73 (9.93%) Replication
4 63 (8.57%) Public Cloud
5 39 (5.31%) Distributed Systems
6 26 (3.54%) Private Cloud
7 24 (3.27%) Sports Betting
8 22 (2.99%) Management Information System
9 19 (2.59%) Self-Motivation
10 16 (2.18%) Data Structures
10 16 (2.18%) Mainframe
11 15 (2.04%) PKI
11 15 (2.04%) Product Ownership
12 14 (1.90%) Algorithms
12 14 (1.90%) Hybrid Cloud
12 14 (1.90%) Onboarding
13 12 (1.63%) Hedge funds
14 11 (1.50%) Team-Oriented Environment
15 8 (1.09%) CMDB
15 8 (1.09%) Enterprise Software
Operating Systems
1 177 (24.08%) Windows
2 151 (20.54%) Linux
3 118 (16.05%) Windows Server
4 27 (3.67%) Red Hat Enterprise Linux
5 24 (3.27%) Windows Server 2012
6 23 (3.13%) Windows Server 2019
7 22 (2.99%) Unix
8 20 (2.72%) Windows Server 2016
9 16 (2.18%) HPUX
9 16 (2.18%) Solaris
10 11 (1.50%) Windows 10
11 10 (1.36%) Windows 7
11 10 (1.36%) Windows 8
12 9 (1.22%) CentOS
13 8 (1.09%) Android
13 8 (1.09%) Apple iOS
14 5 (0.68%) VMS
15 3 (0.41%) Debian
15 3 (0.41%) Windows Server 2008
16 2 (0.27%) AIX
Processes & Methodologies
1 279 (37.96%) Problem-Solving
2 227 (30.88%) DevOps
3 184 (25.03%) Agile
4 171 (23.27%) Disaster Recovery
5 164 (22.31%) CI/CD
6 106 (14.42%) Infrastructure as Code
7 100 (13.61%) Migration
8 96 (13.06%) Infrastructure Engineering
8 96 (13.06%) Microservices
9 86 (11.70%) ITIL
10 79 (10.75%) Capacity Planning
11 73 (9.93%) Configuration Management
11 73 (9.93%) Continuous Integration
12 70 (9.52%) Load Balancing
13 67 (9.12%) Mentoring
13 67 (9.12%) Performance Tuning
14 66 (8.98%) Software Engineering
15 63 (8.57%) Containerisation
16 60 (8.16%) Computer Science
16 60 (8.16%) User Experience
Programming Languages
1 180 (24.49%) SQL
2 155 (21.09%) Python
3 121 (16.46%) PowerShell
4 97 (13.20%) Java
5 65 (8.84%) Bash
6 39 (5.31%) C#
6 39 (5.31%) JavaScript
7 33 (4.49%) Go
8 26 (3.54%) T-SQL
9 23 (3.13%) Shell Script
10 20 (2.72%) Ruby
11 16 (2.18%) PHP
12 15 (2.04%) Perl
12 15 (2.04%) TypeScript
13 10 (1.36%) C++
14 9 (1.22%) Bicep
14 9 (1.22%) PL/SQL
15 8 (1.09%) C
16 6 (0.82%) Scala
17 4 (0.54%) ABAP
Qualifications
1 125 (17.01%) Security Cleared
2 97 (13.20%) Degree
3 92 (12.52%) SC Cleared
4 44 (5.99%) Azure Certification
5 41 (5.58%) Computer Science Degree
6 29 (3.95%) Microsoft Certification
7 28 (3.81%) Cisco Certification
8 18 (2.45%) CCNP
9 14 (1.90%) MCSA
10 13 (1.77%) CCNA
11 12 (1.63%) AWS Certification
11 12 (1.63%) DV Cleared
12 11 (1.50%) CISSP
12 11 (1.50%) GSEC
13 10 (1.36%) Master's Degree
14 8 (1.09%) CCIE
14 8 (1.09%) ITIL Certification
15 7 (0.95%) HNC
15 7 (0.95%) HND
16 6 (0.82%) MCSE
Quality Assurance & Compliance
1 49 (6.67%) SLA
2 10 (1.36%) Accessibility
2 10 (1.36%) QA
3 9 (1.22%) NIST
4 7 (0.95%) GDPR
5 4 (0.54%) HIPAA
5 4 (0.54%) ISO/IEC 27001
5 4 (0.54%) Sarbanes-Oxley
6 3 (0.41%) PSD2
7 2 (0.27%) Cyber Essentials
7 2 (0.27%) ISO 22301
8 1 (0.14%) Data Quality
8 1 (0.14%) NCSC
System Software
1 150 (20.41%) Active Directory
2 108 (14.69%) Docker
3 105 (14.29%) VMware Infrastructure
4 56 (7.62%) Hyper-V
5 43 (5.85%) Virtual Machines
6 23 (3.13%) VMware NSX
7 17 (2.31%) Firmware
8 12 (1.63%) Apache ZooKeeper
9 9 (1.22%) VMware ESXi
9 9 (1.22%) VMware Workstation
10 5 (0.68%) Oracle RAC
11 4 (0.54%) KVM
12 2 (0.27%) Virtual Desktop
12 2 (0.27%) Virtual Servers
13 1 (0.14%) BitLocker
13 1 (0.14%) Ceph
13 1 (0.14%) PowerHA
13 1 (0.14%) Slurm Workload Manager
13 1 (0.14%) Varnish
13 1 (0.14%) vSphere
Systems Management
1 126 (17.14%) Terraform
2 123 (16.73%) Kubernetes
3 77 (10.48%) Ansible
4 46 (6.26%) SCOM
5 40 (5.44%) Microsoft Intune
6 33 (4.49%) SCCM
7 26 (3.54%) Failover Clustering
8 23 (3.13%) Single Sign-On
9 20 (2.72%) Microsoft Data Protection Manager
9 20 (2.72%) SCVMM
10 18 (2.45%) Progress Chef
10 18 (2.45%) Puppet
11 17 (2.31%) FortiGate
12 12 (1.63%) Oracle RMAN
13 11 (1.50%) Grafana
13 11 (1.50%) Nagios
14 7 (0.95%) Packer
14 7 (0.95%) Prometheus
15 6 (0.82%) Data Guard
16 4 (0.54%) WSUS
Vendors
1 246 (33.47%) Microsoft
2 144 (19.59%) VMware
3 91 (12.38%) Cisco
4 65 (8.84%) Veeam
5 59 (8.03%) Oracle
6 48 (6.53%) HP
7 44 (5.99%) Citrix
8 38 (5.17%) Commvault
9 33 (4.49%) Aruba
10 31 (4.22%) Kaseya
11 26 (3.54%) IBM
11 26 (3.54%) Nimble Storage
12 25 (3.40%) CheckPoint
12 25 (3.40%) Mitel
12 25 (3.40%) Zerto
13 22 (2.99%) Google
13 22 (2.99%) SolarWinds
14 20 (2.72%) Palo Alto
15 17 (2.31%) Barracuda Networks
16 16 (2.18%) Red Hat