Technical Leadership
UK

The following table provides summary statistics for permanent job vacancies with a requirement for Technical Leadership skills. Included is a benchmarking guide to the salaries offered in vacancies that have cited Technical Leadership over the 6 months to 5 December 2023 with a comparison to the same period in the previous 2 years.

6 months to
5 Dec 2023
Same period 2022 Same period 2021
Rank 149 201 212
Rank change year-on-year +52 +11 +2
Permanent jobs citing Technical Leadership 1,218 2,392 2,260
As % of all permanent jobs advertised in the UK 2.28% 1.93% 1.77%
As % of the Processes & Methodologies category 2.42% 2.01% 1.86%
Number of salaries quoted 784 1,373 1,377
10th Percentile £49,378 £47,000 £45,253
25th Percentile £61,738 £57,500 £55,000
Median annual salary (50th Percentile) £73,500 £78,142 £71,640
Median % change year-on-year -5.94% +9.08% +6.13%
75th Percentile £90,000 £92,500 £90,000
90th Percentile £115,000 £112,500 £110,000
UK excluding London median annual salary £70,576 £66,000 £62,500
% change year-on-year +6.93% +5.60% +2.88%

All Process and Methodology Skills
UK

Technical Leadership is in the Processes and Methodologies category. The following table is for comparison with the above and provides summary statistics for all permanent job vacancies with a requirement for process or methodology skills.

Permanent vacancies with a requirement for process or methodology skills 50,261 118,879 121,556
As % of all permanent jobs advertised in the UK 94.08% 95.74% 95.44%
Number of salaries quoted 36,398 72,456 81,203
10th Percentile £32,500 £34,500 £32,500
25th Percentile £43,750 £45,000 £42,500
Median annual salary (50th Percentile) £60,000 £60,000 £60,000
Median % change year-on-year - - +9.09%
75th Percentile £80,000 £82,500 £77,500
90th Percentile £100,000 £100,000 £95,000
UK excluding London median annual salary £52,500 £53,500 £50,000
% change year-on-year -1.87% +7.00% +4.17%

Technical Leadership
Job Vacancy Trend

Job postings citing Technical Leadership as a proportion of all IT jobs advertised.
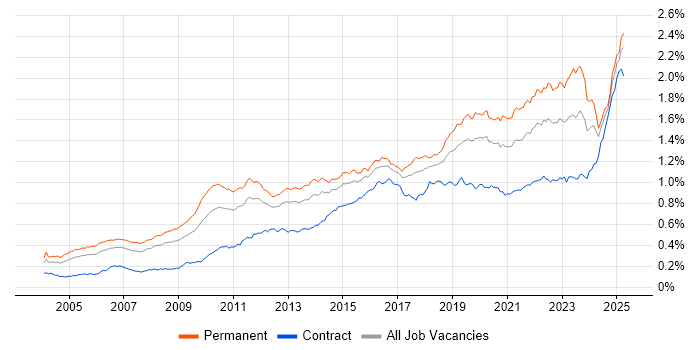
Job vacancy trend for Technical Leadership in the UK

Technical Leadership
Salary Trend

3-month moving average salary quoted in jobs citing Technical Leadership.

Salary trend for Technical Leadership in the UK

Technical Leadership
Salary Histogram

Salary distribution for jobs citing Technical Leadership over the 6 months to 5 December 2023.

Salary histogram for Technical Leadership in the UK

Technical Leadership
Top 17 Job Locations

The table below looks at the demand and provides a guide to the median salaries quoted in IT jobs citing Technical Leadership within the UK over the 6 months to 5 December 2023. The 'Rank Change' column provides an indication of the change in demand within each location based on the same 6 month period last year.

Location Rank Change
on Same Period
Last Year
Matching
Permanent
IT Job Ads
Median Salary
Past 6 Months
Median Salary
% Change
on Same Period
Last Year
Live
Jobs
England +54 1,032 £75,000 -6.25% 527
UK excluding London +34 766 £70,576 +6.93% 343
Work from Home +55 640 £72,500 -9.38% 274
London +58 375 £85,000 -5.56% 221
North of England +97 199 £70,000 -6.67% 80
South West +33 167 £65,242 +8.74% 57
South East +27 167 £72,750 +16.40% 117
North West +78 98 £70,000 - 45
Yorkshire +106 94 £65,066 -17.52% 17
Scotland +34 94 £70,576 +12.92% 20
Midlands +21 78 £67,500 +3.85% 45
West Midlands +25 50 £64,600 -0.62% 39
East Midlands +26 28 £73,500 +22.50% 6
East of England +15 28 £67,500 -10.00% 30
Wales +17 19 £44,033 -29.55%
Northern Ireland +34 16 £60,000 -15.49% 5
North East +36 7 £65,000 -13.33% 18

Technical Leadership
Co-occurring Skills and Capabilities by Category

The follow tables expand on the table above by listing co-occurrences grouped by category. The same employment type, locality and period is covered with up to 20 co-occurrences shown in each of the following categories:

Application Platforms
1 37 (3.04%) Apache Spark
2 26 (2.13%) SharePoint
3 23 (1.89%) SAS
4 17 (1.40%) Tomcat
5 16 (1.31%) Jetty
6 13 (1.07%) Confluence
7 10 (0.82%) IIS
8 7 (0.57%) CMS
9 6 (0.49%) Anypoint
9 6 (0.49%) Kentico
10 5 (0.41%) Oracle SOA Suite
11 4 (0.33%) ArcGIS
11 4 (0.33%) ArcSDE
11 4 (0.33%) SharePoint 2010
11 4 (0.33%) SharePoint 2013
12 3 (0.25%) CICS
12 3 (0.25%) MS Exchange
12 3 (0.25%) OpenStack
13 2 (0.16%) Cloud Foundry
13 2 (0.16%) Moodle
Applications
1 9 (0.74%) Microsoft Office
2 6 (0.49%) Microsoft Excel
3 5 (0.41%) Chatbot
4 4 (0.33%) Autodesk Inventor
5 3 (0.25%) Microsoft PowerPoint
5 3 (0.25%) MS Visio
6 2 (0.16%) CATIA
6 2 (0.16%) Microsoft Project
7 1 (0.082%) Oracle Smart View
7 1 (0.082%) Siemens NX
Business Applications
1 13 (1.07%) Dynamics CRM
2 8 (0.66%) Unit4 Business World
3 6 (0.49%) SAP S/4HANA
4 4 (0.33%) Infor M3
4 4 (0.33%) Maximo
4 4 (0.33%) SAP ERP
4 4 (0.33%) Teamcenter
5 2 (0.16%) Dynamics NAV
5 2 (0.16%) Salesforce CRM
5 2 (0.16%) SAP MM
5 2 (0.16%) Sparx Enterprise Architect
6 1 (0.082%) Dynamics AX
6 1 (0.082%) HFM
6 1 (0.082%) NetSuite
6 1 (0.082%) Payment Gateway
6 1 (0.082%) SAP CO
6 1 (0.082%) SAP FI
6 1 (0.082%) SAP FI/CO
6 1 (0.082%) SAP SD
6 1 (0.082%) SAP SEM
Cloud Services
1 340 (27.91%) Azure
2 217 (17.82%) AWS
3 88 (7.22%) GCP
4 76 (6.24%) SaaS
5 71 (5.83%) Azure DevOps
6 61 (5.01%) Microsoft 365
7 59 (4.84%) Power Platform
8 51 (4.19%) PaaS
9 48 (3.94%) Serverless
10 39 (3.20%) IaaS
11 38 (3.12%) AWS CloudFormation
12 32 (2.63%) Entra ID
13 23 (1.89%) GitHub
14 20 (1.64%) PowerApps
15 19 (1.56%) Dynamics 365
15 19 (1.56%) OpenShift
16 16 (1.31%) Azure Service Bus
17 14 (1.15%) Azure Logic Apps
18 13 (1.07%) Azure Functions
18 13 (1.07%) Power Automate
Communications & Networking
1 45 (3.69%) DNS
2 35 (2.87%) TCP/IP
3 33 (2.71%) DHCP
4 32 (2.63%) Wireless
5 31 (2.55%) Firewall
5 31 (2.55%) HTTP
5 31 (2.55%) Internet
6 30 (2.46%) WAN
7 20 (1.64%) Network Security
8 16 (1.31%) SD-WAN
9 14 (1.15%) VPN
10 12 (0.99%) LAN
11 11 (0.90%) 5G
12 10 (0.82%) MPLS
12 10 (0.82%) SAN
13 8 (0.66%) BGP
14 7 (0.57%) Wi-Fi
15 5 (0.41%) Cisco IOS
15 5 (0.41%) Intrusion Detection
15 5 (0.41%) VLAN
Database & Business Intelligence
1 82 (6.73%) SQL Server
2 80 (6.57%) Big Data
3 50 (4.11%) Data Lake
4 44 (3.61%) Data Warehouse
5 39 (3.20%) Power BI
6 27 (2.22%) NoSQL
7 21 (1.72%) Azure SQL Database
8 18 (1.48%) Hadoop
9 17 (1.40%) BigQuery
10 13 (1.07%) MongoDB
11 9 (0.74%) Amazon RDS
11 9 (0.74%) DynamoDB
11 9 (0.74%) Relational Database
12 8 (0.66%) Amazon Redshift
12 8 (0.66%) GIS
12 8 (0.66%) Metadata
12 8 (0.66%) MySQL
13 7 (0.57%) DB2
13 7 (0.57%) SQL Server Analysis Services
14 6 (0.49%) DataStage
Development Applications
1 63 (5.17%) Git
2 62 (5.09%) Jenkins
3 39 (3.20%) JIRA
4 17 (1.40%) Subversion
5 12 (0.99%) IBM UrbanCode
6 11 (0.90%) GitLab
6 11 (0.90%) Sonatype Nexus
7 9 (0.74%) Selenium
7 9 (0.74%) SonarQube
7 9 (0.74%) Team Foundation Server
8 7 (0.57%) Cucumber
8 7 (0.57%) JUnit
9 6 (0.49%) CMake
9 6 (0.49%) Mocha
9 6 (0.49%) Spinnaker
9 6 (0.49%) TeamCity
10 5 (0.41%) CA Release Automation
10 5 (0.41%) Maven
10 5 (0.41%) Zephyr
11 4 (0.33%) NUnit
General
1 484 (39.74%) Social Skills
2 368 (30.21%) Finance
3 173 (14.20%) Banking
4 146 (11.99%) Analytical Skills
5 100 (8.21%) Retail
6 96 (7.88%) Inclusion and Diversity
7 64 (5.25%) Influencing Skills
8 55 (4.52%) Presentation Skills
9 50 (4.11%) Legal
10 49 (4.02%) Public Sector
11 36 (2.96%) Marketing
12 31 (2.55%) Organisational Skills
13 29 (2.38%) Retail Banking
14 27 (2.22%) Aerospace
15 23 (1.89%) Law
15 23 (1.89%) Manufacturing
16 22 (1.81%) Telecoms
17 19 (1.56%) Electronics
18 14 (1.15%) Back Office
19 13 (1.07%) Military
Job Titles
1 366 (30.05%) Lead
2 297 (24.38%) Architect
3 234 (19.21%) Senior
4 153 (12.56%) Solutions Architect
5 112 (9.20%) Developer
6 75 (6.16%) Software Engineer
7 64 (5.25%) Lead Developer
7 64 (5.25%) Principal Engineer
8 57 (4.68%) Technical Leader
9 54 (4.43%) Technical Architect
10 41 (3.37%) Senior Architect
10 41 (3.37%) Support Engineer
11 38 (3.12%) DevOps Engineer
12 36 (2.96%) Senior Software Engineer
12 36 (2.96%) Splunk Engineer
13 35 (2.87%) Cloud Engineer
13 35 (2.87%) Data Architect
14 31 (2.55%) Lead Software Engineer
15 29 (2.38%) Analyst
15 29 (2.38%) Team Leader
Libraries, Frameworks & Software Standards
1 137 (11.25%) .NET
2 107 (8.78%) HTML
3 72 (5.91%) Kafka
4 70 (5.75%) CSS
5 65 (5.34%) React
6 61 (5.01%) REST
6 61 (5.01%) Spring
7 53 (4.35%) XML
8 48 (3.94%) Spring Boot
9 47 (3.86%) Web Services
10 41 (3.37%) SAML
11 38 (3.12%) OpenID
12 32 (2.63%) JSON
13 31 (2.55%) .NET Core
13 31 (2.55%) AngularJS
13 31 (2.55%) ASP.NET
14 29 (2.38%) .NET Framework
15 27 (2.22%) RESTful
16 24 (1.97%) Node.js
17 22 (1.81%) jQuery
Miscellaneous
1 85 (6.98%) Cloud Native
2 73 (5.99%) Public Cloud
3 68 (5.58%) Product Ownership
4 41 (3.37%) Data Centre
5 39 (3.20%) Cyberattack
6 36 (2.96%) Blockchain
7 35 (2.87%) Self-Motivation
8 31 (2.55%) Robotics
9 26 (2.13%) Management Information System
10 22 (1.81%) Embedded Systems
11 21 (1.72%) Distributed Systems
12 20 (1.64%) Credit Risk
12 20 (1.64%) Online Banking
12 20 (1.64%) Virtual Team
13 17 (1.40%) Greenfield Project
13 17 (1.40%) IoT
13 17 (1.40%) Legacy Systems
14 16 (1.31%) Enterprise Software
15 15 (1.23%) Algorithms
15 15 (1.23%) PKI
Operating Systems
1 98 (8.05%) Linux
2 95 (7.80%) Windows
3 33 (2.71%) Android
4 23 (1.89%) Windows Server
5 18 (1.48%) Unix
6 10 (0.82%) Mac OS
7 9 (0.74%) Windows 10
8 4 (0.33%) Apple iOS
9 3 (0.25%) Red Hat Enterprise Linux
9 3 (0.25%) VMS
9 3 (0.25%) zOS
10 2 (0.16%) Windows 7
10 2 (0.16%) Windows Server 2016
11 1 (0.082%) CentOS
11 1 (0.082%) Debian
11 1 (0.082%) Embedded Linux
11 1 (0.082%) Mac OS X
11 1 (0.082%) Ubuntu
11 1 (0.082%) Windows Server 2008
11 1 (0.082%) Windows Server 2012
Processes & Methodologies
1 549 (45.07%) Agile
2 323 (26.52%) Mentoring
3 296 (24.30%) Software Engineering
4 291 (23.89%) DevOps
5 223 (18.31%) Roadmaps
6 198 (16.26%) Continuous Improvement
7 196 (16.09%) Problem-Solving
8 186 (15.27%) Microservices
9 153 (12.56%) Actionable Insight
10 150 (12.32%) Coaching
11 149 (12.23%) Software Delivery
12 129 (10.59%) CI/CD
13 124 (10.18%) Line Management
13 124 (10.18%) Presales
13 124 (10.18%) Thought Leadership
14 119 (9.77%) Computer Science
15 113 (9.28%) SDLC
16 112 (9.20%) Stakeholder Management
17 111 (9.11%) Digital Transformation Programme
18 107 (8.78%) Technology Roadmap
Programming Languages
1 175 (14.37%) Java
2 166 (13.63%) Python
3 160 (13.14%) SQL
4 150 (12.32%) JavaScript
5 131 (10.76%) C#
6 70 (5.75%) PowerShell
7 57 (4.68%) C++
8 54 (4.43%) TypeScript
9 33 (2.71%) C
10 31 (2.55%) Bash
11 28 (2.30%) Go
12 20 (1.64%) Groovy
13 16 (1.31%) T-SQL
14 14 (1.15%) Scala
15 10 (0.82%) Apex Code
15 10 (0.82%) Ruby
16 9 (0.74%) Delphi
16 9 (0.74%) Perl
17 7 (0.57%) PHP
18 6 (0.49%) Fortran
Qualifications
1 205 (16.83%) Degree
2 180 (14.78%) Security Cleared
3 96 (7.88%) SC Cleared
4 81 (6.65%) Computer Science Degree
5 53 (4.35%) AWS Certification
6 47 (3.86%) DV Cleared
7 42 (3.45%) AWS Certified Solutions Architect
8 40 (3.28%) TOGAF Certification
9 37 (3.04%) Master's Degree
10 20 (1.64%) Azure Certification
11 19 (1.56%) Microsoft Certification
12 15 (1.23%) BPSS Clearance
13 14 (1.15%) CISSP
14 9 (0.74%) Cisco Certification
14 9 (0.74%) DBS Check
14 9 (0.74%) PMP
15 6 (0.49%) CCNP
16 5 (0.41%) CCNA
17 4 (0.33%) MCSE
17 4 (0.33%) PMI Certification
Quality Assurance & Compliance
1 62 (5.09%) QA
2 28 (2.30%) SEPA
3 19 (1.56%) ISO/IEC 27001
4 16 (1.31%) ISO 20022
5 15 (1.23%) Data Quality
6 11 (0.90%) GDPR
6 11 (0.90%) PMO
7 6 (0.49%) GAAP
7 6 (0.49%) PCI DSS
7 6 (0.49%) SLA
8 5 (0.41%) NCSC
8 5 (0.41%) NIST
9 4 (0.33%) Accessibility
9 4 (0.33%) Cyber Essentials
9 4 (0.33%) Cyber Essentials PLUS
9 4 (0.33%) IFRS
9 4 (0.33%) IFRS 9
9 4 (0.33%) WCAG
10 2 (0.16%) IEC 61508
10 2 (0.16%) ISO 26262
System Software
1 93 (7.64%) Docker
2 49 (4.02%) Active Directory
3 23 (1.89%) VMware Infrastructure
4 21 (1.72%) Firmware
5 13 (1.07%) Embedded Firmware
6 11 (0.90%) Virtual Machines
7 9 (0.74%) Hyper-V
8 3 (0.25%) RACF
8 3 (0.25%) Time Sharing Option
8 3 (0.25%) Virtual Servers
8 3 (0.25%) VMware ESXi
8 3 (0.25%) vSphere
9 2 (0.16%) Citrix Hypervisor
10 1 (0.082%) BitLocker
10 1 (0.082%) KVM
10 1 (0.082%) Terminal Server
10 1 (0.082%) Virtual Desktop
10 1 (0.082%) VirtualBox
Systems Management
1 123 (10.10%) Kubernetes
2 104 (8.54%) Terraform
3 44 (3.61%) Ansible
4 18 (1.48%) Puppet
5 16 (1.31%) Progress Chef
6 15 (1.23%) Nagios
6 15 (1.23%) Single Sign-On
7 13 (1.07%) Microsoft Intune
8 6 (0.49%) Kibana
8 6 (0.49%) Prometheus
8 6 (0.49%) SCCM
9 5 (0.41%) Istio
9 5 (0.41%) Packer
10 4 (0.33%) Grafana
10 4 (0.33%) NetBackup
10 4 (0.33%) WSUS
10 4 (0.33%) ZABBIX
11 3 (0.25%) Cacti
11 3 (0.25%) FortiGate
11 3 (0.25%) MAINVIEW
Vendors
1 151 (12.40%) Microsoft
2 67 (5.50%) Google
3 49 (4.02%) Splunk
4 45 (3.69%) Databricks
5 39 (3.20%) Salesforce
6 29 (2.38%) VMware
7 23 (1.89%) Cisco
7 23 (1.89%) IBM
8 18 (1.48%) Oracle
9 17 (1.40%) SAP
10 13 (1.07%) MuleSoft
10 13 (1.07%) NetApp
11 12 (0.99%) New Relic
12 11 (0.90%) Confluent
12 11 (0.90%) Juniper
13 10 (0.82%) Citrix
13 10 (0.82%) Dell
13 10 (0.82%) F5
14 8 (0.66%) Dynatrace
14 8 (0.66%) EMC