Software Architecture
UK

The following table provides summary statistics for permanent job vacancies with a requirement for Software Architecture skills. Included is a benchmarking guide to the salaries offered in vacancies that have cited Software Architecture over the 6 months to 28 November 2023 with a comparison to the same period in the previous 2 years.

6 months to
28 Nov 2023
Same period 2022 Same period 2021
Rank 353 480 402
Rank change year-on-year +127 -78 +59
Permanent jobs citing Software Architecture 443 827 1,050
As % of all permanent jobs advertised in the UK 0.82% 0.66% 0.82%
As % of the Processes & Methodologies category 0.87% 0.69% 0.86%
Number of salaries quoted 250 469 439
10th Percentile £47,475 £49,750 £37,750
25th Percentile £53,750 £56,250 £48,750
Median annual salary (50th Percentile) £67,500 £77,500 £65,000
Median % change year-on-year -12.90% +19.23% -
75th Percentile £77,221 £91,250 £84,375
90th Percentile £100,000 £105,000 £102,000
UK excluding London median annual salary £67,500 £60,000 £55,000
% change year-on-year +12.50% +9.09% +4.76%

All Process and Methodology Skills
UK

Software Architecture is in the Processes and Methodologies category. The following table is for comparison with the above and provides summary statistics for all permanent job vacancies with a requirement for process or methodology skills.

Permanent vacancies with a requirement for process or methodology skills 51,121 120,104 122,523
As % of all permanent jobs advertised in the UK 94.09% 95.72% 95.43%
Number of salaries quoted 36,956 73,203 81,032
10th Percentile £32,500 £34,313 £32,500
25th Percentile £43,750 £45,000 £42,500
Median annual salary (50th Percentile) £60,000 £60,000 £59,000
Median % change year-on-year - +1.69% +7.27%
75th Percentile £80,000 £81,250 £77,500
90th Percentile £98,750 £100,000 £95,000
UK excluding London median annual salary £52,500 £53,000 £50,000
% change year-on-year -0.94% +6.00% +4.17%

Software Architecture
Job Vacancy Trend

Job postings citing Software Architecture as a proportion of all IT jobs advertised.
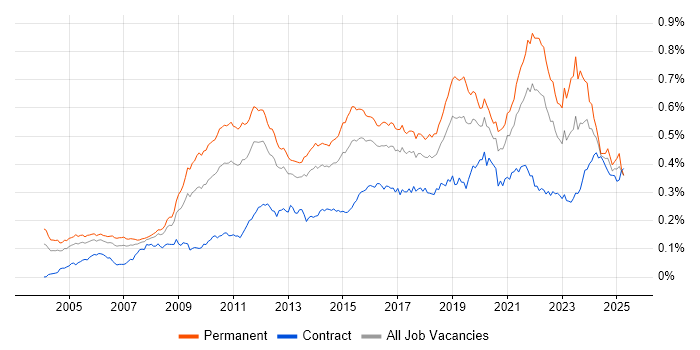
Job vacancy trend for Software Architecture in the UK

Software Architecture
Salary Trend

3-month moving average salary quoted in jobs citing Software Architecture.

Salary trend for Software Architecture in the UK

Software Architecture
Salary Histogram

Salary distribution for jobs citing Software Architecture over the 6 months to 28 November 2023.

Salary histogram for Software Architecture in the UK

Software Architecture
Top 17 Job Locations

The table below looks at the demand and provides a guide to the median salaries quoted in IT jobs citing Software Architecture within the UK over the 6 months to 28 November 2023. The 'Rank Change' column provides an indication of the change in demand within each location based on the same 6 month period last year.

Location Rank Change
on Same Period
Last Year
Matching
Permanent
IT Job Ads
Median Salary
Past 6 Months
Median Salary
% Change
on Same Period
Last Year
Live
Jobs
England +120 371 £67,500 -13.62% 139
UK excluding London +217 340 £67,500 +12.50% 109
Work from Home +106 190 £70,000 -6.67% 84
South West +127 100 £67,500 +17.39% 27
London +16 88 £95,000 +15.15% 48
South East +99 67 £59,000 -11.94% 31
North of England +138 56 £70,576 -5.90% 12
Scotland +72 43 £70,576 +22.74% 1
Midlands +87 34 £67,500 +50.00% 18
North West +123 29 £55,000 +15.79% 4
East of England +119 28 £55,000 - 13
Yorkshire +94 26 £71,538 -4.62% 8
West Midlands +80 19 £70,000 +42.86% 15
East Midlands +43 15 £50,000 +11.11% 3
Northern Ireland +43 8 £45,000 - 2
Wales +19 8 £50,000 -28.57% 5
North East +37 1 £87,500 +20.69%

Software Architecture
Co-occurring Skills and Capabilities by Category

The follow tables expand on the table above by listing co-occurrences grouped by category. The same employment type, locality and period is covered with up to 20 co-occurrences shown in each of the following categories:

Application Platforms
1 11 (2.48%) Tomcat
2 4 (0.90%) nginx
2 4 (0.90%) OpenStack
2 4 (0.90%) SAS
2 4 (0.90%) SharePoint
2 4 (0.90%) SharePoint 2010
2 4 (0.90%) SharePoint 2013
3 3 (0.68%) Confluence
4 2 (0.45%) CMS
4 2 (0.45%) Ethereum
4 2 (0.45%) IIS
4 2 (0.45%) NServiceBus
4 2 (0.45%) Sitecore CMS
4 2 (0.45%) Umbraco
5 1 (0.23%) Apache Spark
5 1 (0.23%) Hyperledger
5 1 (0.23%) WebSphere
5 1 (0.23%) WordPress
Applications
1 7 (1.58%) Simulink
2 2 (0.45%) TargetLink
Business Applications
1 4 (0.90%) Maximo
2 3 (0.68%) Payment Gateway
3 2 (0.45%) Distributed Ledger
4 1 (0.23%) Elite 3E
4 1 (0.23%) Magento
4 1 (0.23%) Quorum
4 1 (0.23%) R3 Corda
4 1 (0.23%) Teamcenter
Cloud Services
1 193 (43.57%) AWS
2 191 (43.12%) Azure
3 126 (28.44%) GCP
4 53 (11.96%) SaaS
5 34 (7.67%) GitHub
6 28 (6.32%) OpenShift
7 21 (4.74%) Serverless
8 15 (3.39%) Cloud Computing
9 13 (2.93%) Azure DevOps
10 11 (2.48%) AWS Lambda
11 8 (1.81%) Amazon S3
11 8 (1.81%) Amazon SQS
12 5 (1.13%) Amazon EC2
12 5 (1.13%) Azure Cosmos DB
13 4 (0.90%) Azure Logic Apps
13 4 (0.90%) Azure Service Bus
13 4 (0.90%) Azure Synapse Analytics
13 4 (0.90%) PaaS
13 4 (0.90%) Snowflake
14 3 (0.68%) CloudFront
Communications & Networking
1 55 (12.42%) TCP/IP
2 34 (7.67%) DNS
3 33 (7.45%) HTTP
4 28 (6.32%) DHCP
5 12 (2.71%) Internet
6 8 (1.81%) Firewall
7 4 (0.90%) 5G
7 4 (0.90%) SD-WAN
7 4 (0.90%) SMTP
7 4 (0.90%) WAN
8 3 (0.68%) FlexRay
8 3 (0.68%) Wireless
9 2 (0.45%) Multicast
10 1 (0.23%) IPsec
10 1 (0.23%) Kerberos
10 1 (0.23%) Modbus
10 1 (0.23%) SSL
Database & Business Intelligence
1 34 (7.67%) SQL Server
2 22 (4.97%) NoSQL
3 20 (4.51%) MySQL
4 19 (4.29%) Big Data
5 11 (2.48%) DynamoDB
6 10 (2.26%) PostgreSQL
7 6 (1.35%) Data Warehouse
7 6 (1.35%) Elasticsearch
7 6 (1.35%) MongoDB
7 6 (1.35%) Relational Database
8 4 (0.90%) Azure SQL Database
8 4 (0.90%) Data Lake
9 3 (0.68%) Geospatial Data
9 3 (0.68%) SQL Server Integration Services
9 3 (0.68%) SQL Server Reporting Services
10 1 (0.23%) Amazon RDS
10 1 (0.23%) Apache Cassandra
10 1 (0.23%) Hadoop
10 1 (0.23%) Power BI
10 1 (0.23%) Redis
Development Applications
1 51 (11.51%) Git
2 25 (5.64%) Jenkins
3 14 (3.16%) JIRA
4 12 (2.71%) Maven
5 11 (2.48%) Bitbucket
6 10 (2.26%) Postman
7 8 (1.81%) Selenium
8 7 (1.58%) GitLab
9 6 (1.35%) Team Foundation Server
10 4 (0.90%) Mocha
10 4 (0.90%) Visual Studio
11 3 (0.68%) Cucumber
11 3 (0.68%) JSUnit
11 3 (0.68%) JUnit
11 3 (0.68%) TestRail
12 2 (0.45%) Crashlytics
12 2 (0.45%) Hudson
12 2 (0.45%) Rational DOORS
12 2 (0.45%) SoapUI
12 2 (0.45%) SpecFlow
General
1 92 (20.77%) Telecoms
2 63 (14.22%) Finance
3 47 (10.61%) Social Skills
4 41 (9.26%) Analytical Skills
5 39 (8.80%) Legal
6 38 (8.58%) Banking
7 15 (3.39%) Marketing
7 15 (3.39%) Retail
8 13 (2.93%) Electronics
8 13 (2.93%) Influencing Skills
9 11 (2.48%) Aerospace
9 11 (2.48%) Law
10 10 (2.26%) Automotive
11 8 (1.81%) Billing
12 7 (1.58%) Manufacturing
12 7 (1.58%) Public Sector
13 6 (1.35%) Organisational Skills
14 5 (1.13%) Presentation Skills
15 4 (0.90%) Back Office
15 4 (0.90%) Inclusion and Diversity
Job Titles
1 170 (38.37%) Architect
2 135 (30.47%) Solutions Architect
3 111 (25.06%) Developer
4 105 (23.70%) Senior
5 91 (20.54%) Enterprise Architect
6 89 (20.09%) Enterprise Solutions Architect
7 60 (13.54%) Software Engineer
8 55 (12.42%) Senior Developer
9 26 (5.87%) Lead
10 23 (5.19%) Infrastructure Engineer
11 21 (4.74%) Software Architect
12 19 (4.29%) C# Developer
13 18 (4.06%) Linux Engineer
14 17 (3.84%) Android Developer
14 17 (3.84%) Senior Architect
15 16 (3.61%) Java Developer
16 15 (3.39%) DevOps Engineer
17 14 (3.16%) Embedded Engineer
17 14 (3.16%) Principal Architect
17 14 (3.16%) Senior Android Developer
Libraries, Frameworks & Software Standards
1 65 (14.67%) .NET
2 55 (12.42%) Spring
3 53 (11.96%) React
4 51 (11.51%) HTML
5 47 (10.61%) CSS
6 45 (10.16%) AngularJS
7 38 (8.58%) Kafka
8 34 (7.67%) Spring Boot
9 28 (6.32%) Node.js
9 28 (6.32%) REST
10 18 (4.06%) RESTful
11 17 (3.84%) .NET Core
12 16 (3.61%) .NET Framework
13 14 (3.16%) Blazor
13 14 (3.16%) JSON
13 14 (3.16%) React Native
14 13 (2.93%) SOAP
14 13 (2.93%) Vue
15 12 (2.71%) ASP.NET
15 12 (2.71%) XML
Miscellaneous
1 19 (4.29%) Self-Motivation
2 18 (4.06%) Embedded Systems
3 17 (3.84%) IoT
4 16 (3.61%) Raspberry Pi
5 15 (3.39%) Blockchain
5 15 (3.39%) Enterprise Software
6 13 (2.93%) Mali
6 13 (2.93%) Robotics
6 13 (2.93%) SWIFT Messaging Network
7 12 (2.71%) Algorithms
7 12 (2.71%) Cloud Native
7 12 (2.71%) Data Structures
8 11 (2.48%) Public Cloud
9 10 (2.26%) Legacy Systems
9 10 (2.26%) Mobile App
10 9 (2.03%) Management Information System
11 8 (1.81%) Arduino
11 8 (1.81%) Greenfield Project
11 8 (1.81%) Product Ownership
12 7 (1.58%) Hedge funds
Operating Systems
1 82 (18.51%) Linux
2 44 (9.93%) Android
3 34 (7.67%) Windows
4 28 (6.32%) Red Hat Enterprise Linux
5 14 (3.16%) Apple iOS
6 6 (1.35%) Windows Server
7 5 (1.13%) Unix
8 2 (0.45%) Embedded Linux
Processes & Methodologies
1 245 (55.30%) Agile
2 189 (42.66%) DevOps
3 142 (32.05%) Actionable Insight
4 131 (29.57%) Computer Science
5 114 (25.73%) Requirements Analysis
6 102 (23.02%) TOGAF
6 102 (23.02%) Validation
7 98 (22.12%) Mathematics
8 95 (21.44%) Enterprise Architecture
9 94 (21.22%) Cybersecurity
10 92 (20.77%) Physics
11 91 (20.54%) Microservices
12 90 (20.32%) Technical Analysis
13 89 (20.09%) Model Validation
13 89 (20.09%) Network Architecture
13 89 (20.09%) Requirements Management
13 89 (20.09%) Software Engineering
14 80 (18.06%) Problem-Solving
15 59 (13.32%) Full Stack Development
16 58 (13.09%) Technical Leadership
Programming Languages
1 130 (29.35%) Java
2 102 (23.02%) JavaScript
2 102 (23.02%) Python
3 67 (15.12%) C#
4 64 (14.45%) C
5 59 (13.32%) SQL
6 56 (12.64%) C++
7 40 (9.03%) TypeScript
8 33 (7.45%) Bash
8 33 (7.45%) PowerShell
9 9 (2.03%) Bicep
10 7 (1.58%) MATLAB
10 7 (1.58%) PHP
10 7 (1.58%) T-SQL
11 6 (1.35%) VB.NET
12 5 (1.13%) Go
12 5 (1.13%) R
13 4 (0.90%) Kotlin
13 4 (0.90%) Perl
14 3 (0.68%) Ada
Qualifications
1 131 (29.57%) Degree
2 104 (23.48%) Computer Science Degree
3 101 (22.80%) Security Cleared
4 89 (20.09%) TOGAF Certification
5 71 (16.03%) SC Cleared
6 25 (5.64%) DV Cleared
7 8 (1.81%) AWS Certification
7 8 (1.81%) Master's Degree
8 4 (0.90%) AWS Certified Developer
8 4 (0.90%) AWS Certified Solutions Architect
8 4 (0.90%) MCPD
8 4 (0.90%) Microsoft Certification
9 2 (0.45%) Azure Certification
10 1 (0.23%) BPSS Clearance
10 1 (0.23%) Chartered Engineer
10 1 (0.23%) PhD
10 1 (0.23%) PMI Certification
Quality Assurance & Compliance
1 28 (6.32%) SEPA
2 26 (5.87%) QA
3 16 (3.61%) ISO 20022
4 8 (1.81%) ISO 26262
5 7 (1.58%) AUTOSAR
6 5 (1.13%) Automotive SPICE
7 4 (0.90%) GRC
8 3 (0.68%) MISRA
9 2 (0.45%) Data Quality
9 2 (0.45%) DO-178B
10 1 (0.23%) Accessibility
10 1 (0.23%) HAZOP
10 1 (0.23%) ISO 15022
10 1 (0.23%) WAI
System Software
1 95 (21.44%) Docker
2 28 (6.32%) Hyper-V
2 28 (6.32%) VMware Infrastructure
3 18 (4.06%) Firmware
4 16 (3.61%) Embedded Firmware
5 5 (1.13%) Active Directory
6 1 (0.23%) RACF
6 1 (0.23%) Virtual Machines
Systems Management
1 80 (18.06%) Kubernetes
2 32 (7.22%) Ansible
3 28 (6.32%) Puppet
4 10 (2.26%) Terraform
5 7 (1.58%) Functional Safety
6 4 (0.90%) Podman
6 4 (0.90%) Progress Chef
7 1 (0.23%) Docker Swarm
7 1 (0.23%) Single Sign-On
Vendors
1 31 (7.00%) Microsoft
2 28 (6.32%) Red Hat
2 28 (6.32%) VMware
3 19 (4.29%) Google
4 8 (1.81%) Apple
5 4 (0.90%) Rackspace
6 3 (0.68%) SAP
7 2 (0.45%) Intel
7 2 (0.45%) Salesforce
7 2 (0.45%) Sitecore
8 1 (0.23%) Oracle
8 1 (0.23%) Samsung