Full-Stack Development Job Trends

Full-Stack Development
UK

The table below provides summary statistics and salary benchmarking for jobs requiring Full-Stack Development skills. It covers permanent job vacancies from the 6 months leading up to 21 November 2025, with comparisons to the same periods in the previous two years.

6 months to
21 Nov 2025
Same period 2024 Same period 2023
Rank 119 51 68
Rank change year-on-year -68 +17 -12
Permanent jobs citing Full-Stack Development 1,215 2,965 2,152
As % of all permanent jobs in the UK 2.28% 4.40% 4.14%
As % of the Processes & Methodologies category 2.66% 5.26% 4.41%
Number of salaries quoted 913 1,577 1,923
10th Percentile £42,750 £41,250 £42,500
25th Percentile £55,000 £48,750 £51,250
Median annual salary (50th Percentile) £70,000 £65,000 £67,500
Median % change year-on-year +7.69% -3.70% +3.85%
75th Percentile £90,000 £83,750 £87,500
90th Percentile £120,000 £98,750 £115,000
UK excluding London median annual salary £60,000 £55,000 £56,409
% change year-on-year +9.09% -2.50% +2.56%

All Process and Methodology Skills
UK

Full-Stack Development falls under the Processes and Methodologies category. For comparison with the information above, the following table provides summary statistics for all permanent job vacancies requiring process or methodology skills.

Permanent vacancies with a requirement for process or methodology skills 45,592 56,393 48,809
As % of all permanent jobs advertised in the UK 85.45% 83.65% 93.81%
Number of salaries quoted 27,617 29,299 37,445
10th Percentile £28,250 £34,404 £32,500
25th Percentile £36,250 £45,000 £43,750
Median annual salary (50th Percentile) £55,000 £60,000 £60,000
Median % change year-on-year -8.33% - -
75th Percentile £75,000 £80,000 £80,000
90th Percentile £95,000 £97,500 £98,750
UK excluding London median annual salary £47,500 £55,000 £52,500
% change year-on-year -13.64% +4.76% -

Full-Stack Development
Job Vacancy Trend

Historical trend showing the proportion of permanent IT job postings citing Full-Stack Development relative to all permanent IT jobs advertised.
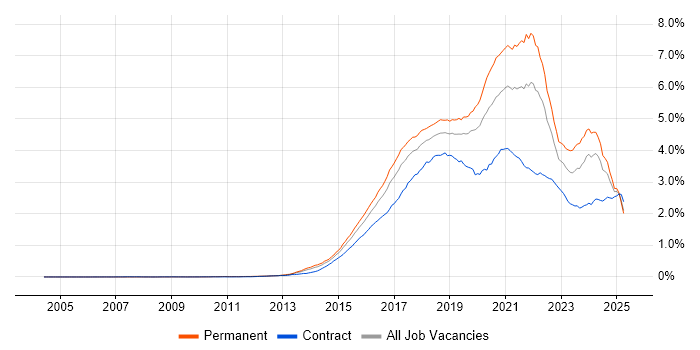
Full-Stack Development job vacancy trend in the UK

Full-Stack Development
Salary Trend

Salary distribution trend for jobs in the UK citing Full-Stack Development.

Salary distribution trend for jobs in the UK citing Full-Stack Development

Full-Stack Development
Salary Histogram

Salary distribution for jobs citing Full-Stack Development over the 6 months to 21 November 2025.

Salary histogram for Full-Stack Development in the UK

Full-Stack Development
Top 18 Job Locations

The table below looks at the demand and provides a guide to the median salaries quoted in IT jobs citing Full-Stack Development within the UK over the 6 months to 21 November 2025. The 'Rank Change' column provides an indication of the change in demand within each location based on the same 6 month period last year.

Location Rank Change
on Same Period
Last Year
Matching
Permanent
IT Job Ads
Median Salary
Past 6 Months
Median Salary
% Change
on Same Period
Last Year
Live
Jobs
England -69 1,065 £70,000 +7.69% 1,725
UK excluding London -91 640 £60,000 +9.09% 1,026
London -23 519 £90,000 +5.88% 879
Work from Home -43 469 £67,500 +8.00% 961
North of England -57 170 £60,000 +4.35% 248
South East -85 158 £60,000 - 339
Midlands -66 95 £60,000 +20.00% 152
North West -28 94 £65,000 +13.04% 142
South West -55 74 £60,000 +9.09% 112
Scotland -25 69 £67,500 +17.39% 38
West Midlands -24 58 £60,000 +9.09% 88
Yorkshire -53 52 £60,000 +9.09% 80
East of England -78 46 £52,000 -20.00% 94
East Midlands -59 37 £62,500 +47.06% 64
North East -17 24 £50,000 -16.67% 29
Wales -32 24 £60,000 +9.09% 35
Northern Ireland -17 5 £60,000 -7.69% 12
Channel Islands +5 1 £90,000 -

Full-Stack Development
Co-Occurring Skills & Capabilities by Category

The following tables expand on the one above by listing co-occurrences grouped by category. They cover the same employment type, locality and period, with up to 20 co-occurrences shown in each category:

Application Platforms
1 17 (1.40%) CMS
2 15 (1.23%) IIS
3 11 (0.91%) SharePoint
4 10 (0.82%) Apache Airflow
5 9 (0.74%) Apache Spark
5 9 (0.74%) Confluence
5 9 (0.74%) Headless CMS
6 6 (0.49%) Apache
6 6 (0.49%) Microsoft Exchange
7 5 (0.41%) nginx
7 5 (0.41%) Oracle Workflow
7 5 (0.41%) Umbraco
8 4 (0.33%) Camunda
8 4 (0.33%) OpenStack
9 3 (0.25%) Drupal
9 3 (0.25%) WordPress
10 2 (0.16%) Appian
10 2 (0.16%) ColdFusion
10 2 (0.16%) Oracle SOA Suite
11 1 (0.082%) Kentico
Applications
1 3 (0.25%) Chatbot
1 3 (0.25%) S-PLUS
2 2 (0.16%) Microsoft Office
3 1 (0.082%) Adobe XD
Business Applications
1 12 (0.99%) Shopify
2 3 (0.25%) Magento
3 2 (0.16%) Dynamics CRM
Cloud Services
1 505 (41.56%) AWS
2 441 (36.30%) Azure
3 130 (10.70%) SaaS
4 126 (10.37%) GitHub
5 122 (10.04%) Serverless
6 106 (8.72%) GCP
7 71 (5.84%) Azure DevOps
8 53 (4.36%) Amazon ECS
9 47 (3.87%) AWS Lambda
10 45 (3.70%) Amazon S3
10 45 (3.70%) GitHub Actions
11 43 (3.54%) Amazon EKS
12 33 (2.72%) Amazon EC2
13 31 (2.55%) PaaS
14 26 (2.14%) Amazon SQS
14 26 (2.14%) Azure Service Bus
15 25 (2.06%) Power Platform
16 24 (1.98%) Azure App Service
17 23 (1.89%) Azure Cosmos DB
17 23 (1.89%) Entra ID
Communications & Networking
1 6 (0.49%) Firewall
2 4 (0.33%) HTTP
2 4 (0.33%) WAN
3 3 (0.25%) Broadband
3 3 (0.25%) DNS
3 3 (0.25%) LAN
3 3 (0.25%) SD-WAN
3 3 (0.25%) TCP/IP
3 3 (0.25%) VLAN
3 3 (0.25%) Wi-Fi
4 2 (0.16%) DHCP
4 2 (0.16%) MQTT
4 2 (0.16%) VPN
5 1 (0.082%) FTP
5 1 (0.082%) Internet
5 1 (0.082%) SAN
5 1 (0.082%) SMS
5 1 (0.082%) SNMP
5 1 (0.082%) SSL
5 1 (0.082%) Wireshark
Database & Business Intelligence
1 154 (12.67%) SQL Server
2 124 (10.21%) PostgreSQL
3 97 (7.98%) MongoDB
4 96 (7.90%) NoSQL
5 92 (7.57%) Relational Database
6 78 (6.42%) MySQL
7 50 (4.12%) Azure SQL Database
8 36 (2.96%) RDBMS
9 29 (2.39%) Elasticsearch
9 29 (2.39%) Redis
10 19 (1.56%) Data Warehouse
11 16 (1.32%) DynamoDB
12 13 (1.07%) Amazon RDS
12 13 (1.07%) Power BI
13 12 (0.99%) Big Data
14 10 (0.82%) Oracle Database
15 8 (0.66%) NonStop SQL
16 7 (0.58%) Apache Cassandra
16 7 (0.58%) Hadoop
17 6 (0.49%) SQL CLR
Development Applications
1 181 (14.90%) Git
2 57 (4.69%) Jenkins
3 48 (3.95%) JIRA
4 41 (3.37%) Cypress.io
5 34 (2.80%) JUnit
6 25 (2.06%) Mockito
7 24 (1.98%) JMeter
8 20 (1.65%) GitLab
9 19 (1.56%) Visual Studio
10 17 (1.40%) Vite
10 17 (1.40%) webpack
11 13 (1.07%) TeamCity
12 11 (0.91%) Maven
13 10 (0.82%) Bitbucket
13 10 (0.82%) Visual Studio Code
14 8 (0.66%) Octopus Deploy
15 7 (0.58%) CircleCI
15 7 (0.58%) Selenium
16 6 (0.49%) Cucumber
17 5 (0.41%) SonarQube
General
1 290 (23.87%) Social Skills
2 249 (20.49%) Finance
3 135 (11.11%) Law
4 102 (8.40%) Inclusion and Diversity
5 71 (5.84%) Banking
6 66 (5.43%) Public Sector
7 65 (5.35%) Marketing
8 49 (4.03%) Front Office
9 46 (3.79%) Analytical Skills
10 39 (3.21%) Investment Banking
11 33 (2.72%) Legal
12 29 (2.39%) Retail
13 18 (1.48%) Health Technology
14 16 (1.32%) Back Office
14 16 (1.32%) Games
14 16 (1.32%) Organisational Skills
15 15 (1.23%) Financial Institution
16 12 (0.99%) Advertising
17 11 (0.91%) Manufacturing
18 10 (0.82%) Tech for Good
Job Titles
1 707 (58.19%) Developer
2 478 (39.34%) Full-Stack Developer
3 272 (22.39%) Senior
3 272 (22.39%) Software Engineer
4 226 (18.60%) Full-Stack Engineer
5 175 (14.40%) Lead
6 161 (13.25%) Senior Developer
7 125 (10.29%) .NET Developer
8 116 (9.55%) Full-Stack Software Engineer
9 114 (9.38%) Senior Full-Stack Developer
10 98 (8.07%) Java Developer
11 93 (7.65%) Software Developer
12 74 (6.09%) Full-Stack Java Developer
13 73 (6.01%) Lead Developer
14 69 (5.68%) Java Engineer
14 69 (5.68%) React Developer
15 61 (5.02%) C# Developer
16 58 (4.77%) Senior Software Engineer
17 56 (4.61%) Lead Software Engineer
18 54 (4.44%) Java Software Engineer
Libraries, Frameworks & Software Standards
1 620 (51.03%) React
2 398 (32.76%) .NET
3 280 (23.05%) AngularJS
4 278 (22.88%) HTML
5 244 (20.08%) Node.js
6 243 (20.00%) CSS
7 187 (15.39%) RESTful
8 176 (14.49%) Vue
9 157 (12.92%) Spring
10 150 (12.35%) .NET Core
11 141 (11.60%) REST
12 129 (10.62%) ASP.NET
13 120 (9.88%) .NET Framework
14 110 (9.05%) Spring Boot
15 108 (8.89%) GraphQL
16 96 (7.90%) Kafka
17 86 (7.08%) Entity Framework
18 80 (6.58%) HTML5
19 75 (6.17%) Next.js
20 66 (5.43%) CSS3
Miscellaneous
1 150 (12.35%) Cloud Native
2 76 (6.26%) Distributed Systems
3 47 (3.87%) Product Ownership
4 36 (2.96%) Algorithms
5 35 (2.88%) Mobile App
6 34 (2.80%) Fixed Income
7 30 (2.47%) Self-Motivation
8 24 (1.98%) Greenfield Project
9 22 (1.81%) Onboarding
10 20 (1.65%) Legacy Systems
11 17 (1.40%) AI Agents
11 17 (1.40%) Reference Data
12 16 (1.32%) Enterprise Software
12 16 (1.32%) Private Cloud
13 15 (1.23%) Hedge funds
14 14 (1.15%) IoT
14 14 (1.15%) Virtual Team
15 13 (1.07%) Data Structures
15 13 (1.07%) Foreign Exchange (FX)
15 13 (1.07%) Management Information System
Operating Systems
1 16 (1.32%) Linux
2 12 (0.99%) Unix
2 12 (0.99%) Windows
3 11 (0.91%) Android
3 11 (0.91%) Apple iOS
4 9 (0.74%) Windows Server
5 3 (0.25%) Windows 10
Processes & Methodologies
1 565 (46.50%) Agile
2 437 (35.97%) CI/CD
3 422 (34.73%) Software Engineering
4 280 (23.05%) DevOps
5 262 (21.56%) Problem-Solving
6 252 (20.74%) Microservices
7 235 (19.34%) AI
8 205 (16.87%) User Experience
9 197 (16.21%) Continuous Improvement
10 181 (14.90%) Mentoring
11 156 (12.84%) SDLC
12 141 (11.60%) Clean Code
13 136 (11.19%) TDD
14 126 (10.37%) Test Automation
15 123 (10.12%) MVC
16 117 (9.63%) Computer Science
17 112 (9.22%) Containerisation
18 109 (8.97%) Scrum
19 107 (8.81%) Machine Learning
20 105 (8.64%) Front End Development
Programming Languages
1 519 (42.72%) JavaScript
2 430 (35.39%) TypeScript
3 397 (32.67%) C#
4 315 (25.93%) Java
5 294 (24.20%) SQL
6 262 (21.56%) Python
7 52 (4.28%) PHP
8 51 (4.20%) Go
9 37 (3.05%) Rust
10 24 (1.98%) Ruby
11 21 (1.73%) Shell Script
12 16 (1.32%) C++
12 16 (1.32%) PL/SQL
13 15 (1.23%) PowerShell
14 11 (0.91%) Bash
14 11 (0.91%) Bicep
15 10 (0.82%) VB.NET
16 9 (0.74%) T-SQL
17 8 (0.66%) C
18 5 (0.41%) Groovy
Qualifications
1 114 (9.38%) Degree
2 106 (8.72%) Security Cleared
3 68 (5.60%) Computer Science Degree
4 60 (4.94%) SC Cleared
5 35 (2.88%) DV Cleared
6 13 (1.07%) AWS Certification
6 13 (1.07%) Master's Degree
7 12 (0.99%) AWS Certified Solutions Architect
8 10 (0.82%) AWS Certified Developer
9 7 (0.58%) Azure Certification
10 5 (0.41%) MCP
11 4 (0.33%) BPSS Clearance
11 4 (0.33%) DBS Check
12 3 (0.25%) Numerate Degree
13 2 (0.16%) CISSP
14 1 (0.082%) Microsoft Certification
Quality Assurance & Compliance
1 78 (6.42%) QA
2 74 (6.09%) Accessibility
3 16 (1.32%) GDPR
4 12 (0.99%) WCAG
5 5 (0.41%) PERC
6 4 (0.33%) ISO/IEC 27001
7 2 (0.16%) ECSS
7 2 (0.16%) NIST
7 2 (0.16%) SLA
7 2 (0.16%) SOC 2
8 1 (0.082%) Actionable Recommendations
8 1 (0.082%) Data Quality
8 1 (0.082%) GRC
8 1 (0.082%) HL7
8 1 (0.082%) MiFID
System Software
1 197 (16.21%) Docker
2 17 (1.40%) Active Directory
3 11 (0.91%) VMware Infrastructure
4 5 (0.41%) Hyper-V
5 4 (0.33%) HDFS
6 2 (0.16%) Firmware
7 1 (0.082%) Virtual Machines
Systems Management
1 180 (14.81%) Kubernetes
2 93 (7.65%) Terraform
3 24 (1.98%) Kibana
4 16 (1.32%) Ansible
5 13 (1.07%) Grafana
6 9 (0.74%) Prometheus
7 8 (0.66%) Argo
8 2 (0.16%) Istio
8 2 (0.16%) Kustomize
8 2 (0.16%) Progress Chef
9 1 (0.082%) FortiGate
9 1 (0.082%) HAProxy
9 1 (0.082%) Kubeflow
9 1 (0.082%) linkerd
9 1 (0.082%) Microsoft Intune
9 1 (0.082%) Nagios
Vendors
1 184 (15.14%) Microsoft
2 39 (3.21%) Oracle
3 30 (2.47%) Splunk
4 28 (2.30%) Dynatrace
5 16 (1.32%) Google
6 13 (1.07%) OpenAI
6 13 (1.07%) VMware
7 11 (0.91%) Databricks
7 11 (0.91%) DevExpress
7 11 (0.91%) Foundry
7 11 (0.91%) Palantir
8 9 (0.74%) Apple
9 7 (0.58%) Facebook
9 7 (0.58%) YouTube
10 6 (0.49%) CrowdStrike
10 6 (0.49%) Fortinet
10 6 (0.49%) Palo Alto
11 5 (0.41%) Rollbar
11 5 (0.41%) Zoho
12 4 (0.33%) Pega