Web Development
UK

The following table provides summary statistics for permanent job vacancies with a requirement for Web Development skills. Included is a benchmarking guide to the salaries offered in vacancies that have cited Web Development over the 6 months to 5 December 2023 with a comparison to the same period in the previous 2 years.

6 months to
5 Dec 2023
Same period 2022 Same period 2021
Rank 229 153 124
Rank change year-on-year -76 -29 -37
Permanent jobs citing Web Development 825 2,959 3,801
As % of all permanent jobs advertised in the UK 1.54% 2.38% 2.98%
As % of the Processes & Methodologies category 1.64% 2.49% 3.13%
Number of salaries quoted 682 1,644 2,434
10th Percentile £35,000 £36,400 £31,250
25th Percentile £42,500 £42,500 £37,000
Median annual salary (50th Percentile) £55,000 £55,000 £50,000
Median % change year-on-year - +10.00% -
75th Percentile £70,000 £70,000 £63,750
90th Percentile £85,000 £86,250 £77,500
UK excluding London median annual salary £50,000 £50,000 £45,000
% change year-on-year - +11.11% -

All Process and Methodology Skills
UK

Web Development is in the Processes and Methodologies category. The following table is for comparison with the above and provides summary statistics for all permanent job vacancies with a requirement for process or methodology skills.

Permanent vacancies with a requirement for process or methodology skills 50,261 118,879 121,556
As % of all permanent jobs advertised in the UK 94.08% 95.74% 95.44%
Number of salaries quoted 36,398 72,456 81,203
10th Percentile £32,500 £34,500 £32,500
25th Percentile £43,750 £45,000 £42,500
Median annual salary (50th Percentile) £60,000 £60,000 £60,000
Median % change year-on-year - - +9.09%
75th Percentile £80,000 £82,500 £77,500
90th Percentile £100,000 £100,000 £95,000
UK excluding London median annual salary £52,500 £53,500 £50,000
% change year-on-year -1.87% +7.00% +4.17%

Web Development
Job Vacancy Trend

Job postings citing Web Development as a proportion of all IT jobs advertised.
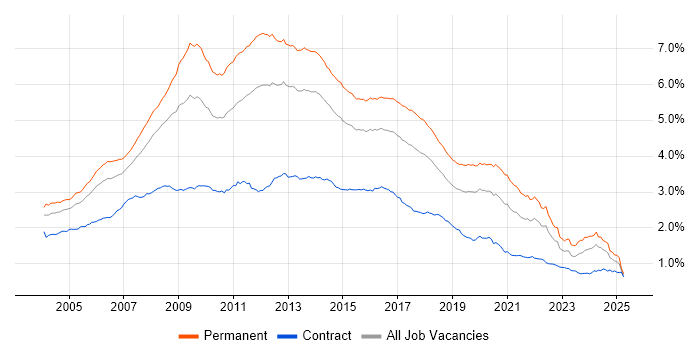
Job vacancy trend for Web Development in the UK

Web Development
Salary Trend

3-month moving average salary quoted in jobs citing Web Development.

Salary trend for Web Development in the UK

Web Development
Salary Histogram

Salary distribution for jobs citing Web Development over the 6 months to 5 December 2023.

Salary histogram for Web Development in the UK

Web Development
Top 17 Job Locations

The table below looks at the demand and provides a guide to the median salaries quoted in IT jobs citing Web Development within the UK over the 6 months to 5 December 2023. The 'Rank Change' column provides an indication of the change in demand within each location based on the same 6 month period last year.

Location Rank Change
on Same Period
Last Year
Matching
Permanent
IT Job Ads
Median Salary
Past 6 Months
Median Salary
% Change
on Same Period
Last Year
Live
Jobs
England -47 734 £55,000 - 519
UK excluding London -85 560 £50,000 - 408
Work from Home -121 357 £55,000 - 319
London -21 236 £65,000 -3.70% 177
South East -62 144 £50,000 -4.76% 125
North of England -24 130 £50,000 - 127
East of England +38 84 £50,000 +6.95% 36
Midlands +14 84 £52,600 +0.19% 56
North West +7 66 £50,000 -4.76% 63
Yorkshire +32 55 £57,500 +15.00% 48
East Midlands +5 55 £49,750 -5.24% 28
South West -37 49 £53,750 +26.47% 32
Scotland -67 46 £50,000 - 14
West Midlands +41 32 £55,000 +1.38% 28
Northern Ireland -22 19 £43,750 +27.74% 10
North East +5 9 £50,000 - 17
Wales -36 7 £50,000 -4.76% 18

Web Development
Co-occurring Skills and Capabilities by Category

The follow tables expand on the table above by listing co-occurrences grouped by category. The same employment type, locality and period is covered with up to 20 co-occurrences shown in each of the following categories:

Application Platforms
1 75 (9.09%) CMS
2 49 (5.94%) WordPress
3 27 (3.27%) SharePoint
4 22 (2.67%) Umbraco
5 14 (1.70%) WebSphere
5 14 (1.70%) WebSphere Application Server
6 12 (1.45%) IIS
7 11 (1.33%) Confluence
8 9 (1.09%) Drupal
9 8 (0.97%) OpenEdge
10 7 (0.85%) Headless CMS
10 7 (0.85%) Sitecore CMS
11 6 (0.73%) Kentico
12 5 (0.61%) ColdFusion
13 4 (0.48%) EPiServer
14 3 (0.36%) DNN
14 3 (0.36%) JBoss
15 2 (0.24%) Adobe Experience Manager
15 2 (0.24%) Moodle
15 2 (0.24%) Oracle SOA Suite
Applications
1 10 (1.21%) Photoshop
2 8 (0.97%) Adobe Illustrator
3 5 (0.61%) Microsoft Excel
4 4 (0.48%) InDesign
5 3 (0.36%) FileZilla
5 3 (0.36%) Microsoft Office
6 2 (0.24%) Acrobat
6 2 (0.24%) Adobe Creative Suite
6 2 (0.24%) Microsoft PowerPoint
6 2 (0.24%) Spreadsheet
7 1 (0.12%) Adobe XD
7 1 (0.12%) Chatbot
Business Applications
1 19 (2.30%) Magento
2 14 (1.70%) Payment Gateway
3 13 (1.58%) Shopify
4 12 (1.45%) iTrent
5 5 (0.61%) Dynamics CRM
6 1 (0.12%) Adobe Campaign
6 1 (0.12%) Unica
Cloud Services
1 158 (19.15%) Azure
2 137 (16.61%) AWS
3 51 (6.18%) Azure DevOps
4 44 (5.33%) Cloud Computing
5 41 (4.97%) Power Platform
6 32 (3.88%) SaaS
7 21 (2.55%) Dynamics 365
8 19 (2.30%) GCP
9 17 (2.06%) Google Analytics
9 17 (2.06%) Serverless
10 16 (1.94%) Figma
10 16 (1.94%) PowerApps
11 14 (1.70%) GitHub
12 10 (1.21%) Microsoft 365
13 9 (1.09%) Amazon EC2
14 8 (0.97%) Amazon S3
14 8 (0.97%) PaaS
15 7 (0.85%) Azure Cognitive Search
15 7 (0.85%) Azure Functions
16 6 (0.73%) Azure Cosmos DB
Communications & Networking
1 25 (3.03%) LAN
1 25 (3.03%) WAN
2 9 (1.09%) Internet
3 8 (0.97%) HTTP
4 4 (0.48%) Intranet
5 3 (0.36%) FTP
5 3 (0.36%) MQTT
6 2 (0.24%) AMQP
6 2 (0.24%) TCP/IP
6 2 (0.24%) Wi-Fi
7 1 (0.12%) DNS
7 1 (0.12%) Firewall
7 1 (0.12%) Network Security
7 1 (0.12%) RS-232
7 1 (0.12%) RS-485
7 1 (0.12%) SSH
7 1 (0.12%) SSL
7 1 (0.12%) VPN
7 1 (0.12%) Wireshark
Database & Business Intelligence
1 174 (21.09%) SQL Server
2 111 (13.45%) MySQL
3 47 (5.70%) PostgreSQL
4 45 (5.45%) Relational Database
5 34 (4.12%) Power BI
6 32 (3.88%) NoSQL
7 16 (1.94%) Geospatial Data
7 16 (1.94%) RDBMS
7 16 (1.94%) Redis
7 16 (1.94%) SQL Server Integration Services
8 14 (1.70%) BusinessObjects
8 14 (1.70%) BusinessObjects Business Intelligence
8 14 (1.70%) MariaDB
8 14 (1.70%) SQL Server Reporting Services
9 13 (1.58%) Big Data
10 12 (1.45%) Azure SQL Database
11 11 (1.33%) Tableau
12 10 (1.21%) MongoDB
13 8 (0.97%) Amazon RDS
13 8 (0.97%) Oracle Database
Development Applications
1 132 (16.00%) Git
2 65 (7.88%) JIRA
3 44 (5.33%) Visual Studio
4 14 (1.70%) Oracle APEX
5 13 (1.58%) Jenkins
5 13 (1.58%) Team Foundation Server
6 11 (1.33%) GitLab
7 9 (1.09%) Selenium
8 7 (0.85%) Maven
8 7 (0.85%) SonarQube
8 7 (0.85%) webpack
9 6 (0.73%) Artifactory
9 6 (0.73%) Cypress.io
9 6 (0.73%) Sonatype Nexus
10 5 (0.61%) Bitbucket
10 5 (0.61%) gulp
10 5 (0.61%) Mocha
11 4 (0.48%) Jasmine
11 4 (0.48%) TeamCity
11 4 (0.48%) Visual Studio Code
General
1 175 (21.21%) Social Skills
2 91 (11.03%) Analytical Skills
3 71 (8.61%) Marketing
4 69 (8.36%) Finance
5 41 (4.97%) Retail
6 35 (4.24%) Inclusion and Diversity
7 27 (3.27%) Games
8 24 (2.91%) Manufacturing
9 19 (2.30%) Public Sector
10 18 (2.18%) Pharmaceutical
11 17 (2.06%) Banking
11 17 (2.06%) Digital Healthcare
12 15 (1.82%) Electronics
13 14 (1.70%) Advertising
14 8 (0.97%) Back Office
14 8 (0.97%) Legal
14 8 (0.97%) Organisational Skills
14 8 (0.97%) Telecoms
15 5 (0.61%) Law
15 5 (0.61%) Multimedia
Job Titles
1 578 (70.06%) Developer
2 165 (20.00%) Web Developer
3 135 (16.36%) Senior
4 121 (14.67%) .NET Developer
5 106 (12.85%) Senior Developer
6 83 (10.06%) Full Stack Developer
7 79 (9.58%) C# Developer
8 77 (9.33%) Software Engineer
9 70 (8.48%) Front-End Developer (Client-Side Developer)
10 66 (8.00%) Software Developer
11 59 (7.15%) Lead
12 55 (6.67%) C# .NET Developer
13 50 (6.06%) Analyst
14 45 (5.45%) PHP Developer
15 37 (4.48%) Lead Developer
16 32 (3.88%) .NET Software Engineer
17 30 (3.64%) Full-Stack C# Developer
17 30 (3.64%) Senior .NET Developer
18 29 (3.52%) Junior
19 27 (3.27%) Applications Support
Libraries, Frameworks & Software Standards
1 413 (50.06%) CSS
2 396 (48.00%) HTML
3 315 (38.18%) .NET
4 210 (25.45%) React
5 150 (18.18%) AngularJS
6 125 (15.15%) ASP.NET
7 114 (13.82%) Vue
8 108 (13.09%) jQuery
9 97 (11.76%) .NET Core
10 94 (11.39%) HTML5
11 86 (10.42%) Laravel
12 82 (9.94%) Node.js
13 75 (9.09%) .NET Framework
14 71 (8.61%) ASP.NET Web API
15 70 (8.48%) Web Services
16 63 (7.64%) REST
17 56 (6.79%) RESTful
17 56 (6.79%) XML
18 51 (6.18%) Sass
19 49 (5.94%) JSON
Miscellaneous
1 34 (4.12%) Product Ownership
2 32 (3.88%) Greenfield Project
3 29 (3.52%) Mobile App
4 19 (2.30%) Legacy Systems
5 15 (1.82%) Management Information System
6 14 (1.70%) Cloud Native
7 13 (1.58%) Self-Motivation
8 11 (1.33%) Data Structures
9 10 (1.21%) Public Cloud
10 8 (0.97%) Distributed Systems
10 8 (0.97%) Enterprise Software
11 7 (0.85%) Social Media
11 7 (0.85%) Team-Oriented Environment
12 6 (0.73%) Marketing Technology
12 6 (0.73%) Mobile Games
13 5 (0.61%) Algorithms
13 5 (0.61%) Linux Command Line
13 5 (0.61%) Virtual Team
14 4 (0.48%) Distributed Applications
14 4 (0.48%) VLE
Operating Systems
1 41 (4.97%) Linux
2 40 (4.85%) Windows
3 17 (2.06%) Unix
3 17 (2.06%) Windows Server
4 16 (1.94%) Android
4 16 (1.94%) Apple iOS
5 8 (0.97%) Mac OS
6 2 (0.24%) Debian
7 1 (0.12%) CentOS
7 1 (0.12%) Red Hat Enterprise Linux
7 1 (0.12%) Ubuntu
7 1 (0.12%) VMS
7 1 (0.12%) Windows Server 2019
Processes & Methodologies
1 309 (37.45%) Agile
2 204 (24.73%) Full Stack Development
3 182 (22.06%) MVC
4 141 (17.09%) Problem-Solving
5 133 (16.12%) Front End Development
5 133 (16.12%) Software Engineering
6 122 (14.79%) User Experience
7 121 (14.67%) DevOps
8 104 (12.61%) E-Commerce
9 90 (10.91%) Mentoring
10 88 (10.67%) Computer Science
11 79 (9.58%) Scrum
12 76 (9.21%) OOP
13 74 (8.97%) Unit Testing
14 73 (8.85%) OO
15 57 (6.91%) Analytics
15 57 (6.91%) TDD
16 50 (6.06%) UX Design
17 49 (5.94%) CRM
17 49 (5.94%) SDLC
Programming Languages
1 524 (63.52%) JavaScript
2 279 (33.82%) C#
3 273 (33.09%) SQL
4 160 (19.39%) PHP
5 110 (13.33%) Python
6 95 (11.52%) Java
7 87 (10.55%) TypeScript
8 37 (4.48%) VB
9 30 (3.64%) PowerShell
9 30 (3.64%) T-SQL
10 23 (2.79%) JSX
11 22 (2.67%) Ruby
12 17 (2.06%) VB.NET
13 15 (1.82%) PL/SQL
14 12 (1.45%) BrightScript
14 12 (1.45%) Kotlin
14 12 (1.45%) Objective-C
15 11 (1.33%) C++
16 9 (1.09%) VBA
17 8 (0.97%) Progress 4GL
Qualifications
1 161 (19.52%) Degree
2 52 (6.30%) Computer Science Degree
3 29 (3.52%) Security Cleared
4 23 (2.79%) SC Cleared
5 17 (2.06%) Master's Degree
6 15 (1.82%) ITIL Certification
7 7 (0.85%) Azure Certification
8 6 (0.73%) Microsoft Certification
9 5 (0.61%) BPSS Clearance
9 5 (0.61%) CTC Cleared
10 3 (0.36%) DV Cleared
11 1 (0.12%) CEH
11 1 (0.12%) CISMP
11 1 (0.12%) CISSP
11 1 (0.12%) CSSLP
11 1 (0.12%) HNC
11 1 (0.12%) ISTQB
11 1 (0.12%) ITIL Foundation Certificate
Quality Assurance & Compliance
1 59 (7.15%) QA
2 29 (3.52%) Accessibility
3 6 (0.73%) WCAG
4 5 (0.61%) GDPR
5 1 (0.12%) ISO/IEC 27001
5 1 (0.12%) SLA
System Software
1 39 (4.73%) Docker
2 15 (1.82%) Active Directory
3 3 (0.36%) Firmware
3 3 (0.36%) Virtual Servers
4 2 (0.24%) Hyper-V
5 1 (0.12%) Microsoft Virtual Server
Systems Management
1 26 (3.15%) Kubernetes
2 13 (1.58%) Terraform
3 3 (0.36%) cPanel
4 1 (0.12%) Ansible
4 1 (0.12%) Docker Swarm
4 1 (0.12%) Kustomize
4 1 (0.12%) Nmap
4 1 (0.12%) SELinux
Vendors
1 158 (19.15%) Microsoft
2 42 (5.09%) Google
3 34 (4.12%) Oracle
4 16 (1.94%) ServiceNow
5 12 (1.45%) ESRI
6 11 (1.33%) Adobe
7 9 (1.09%) Dataiku
8 8 (0.97%) Progress
9 7 (0.85%) Sitecore
10 6 (0.73%) SAP
11 5 (0.61%) Salesforce
11 5 (0.61%) Zoho
12 4 (0.48%) Salesforce Marketing Cloud
12 4 (0.48%) Xamarin
13 3 (0.36%) NVIDIA
14 2 (0.24%) Axosoft
14 2 (0.24%) Hotjar
14 2 (0.24%) Mercator
14 2 (0.24%) Quadient
14 2 (0.24%) WooCommerce