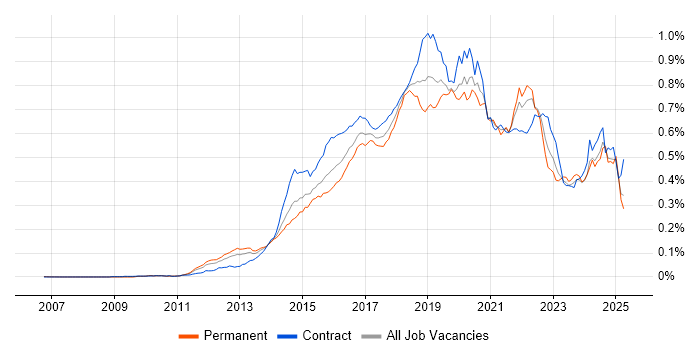
Continuous Deployment Jobs

Continuous Deployment
UK

The table below provides summary statistics for permanent job vacancies requiring Continuous Deployment skills. It includes a benchmarking guide to the annual salaries offered in vacancies that cited Continuous Deployment over the 6 months leading up to 1 May 2025, comparing them to the same period in the previous two years.

6 months to
1 May 2025
Same period 2024 Same period 2023
Rank 488 535 606
Rank change year-on-year +47 +71 -189
Permanent jobs citing Continuous Deployment 207 394 415
As % of all permanent jobs advertised in the UK 0.40% 0.40% 0.40%
As % of the Processes & Methodologies category 0.43% 0.47% 0.42%
Number of salaries quoted 99 262 264
10th Percentile £52,574 £46,250 £47,250
25th Percentile £63,000 £50,000 £52,500
Median annual salary (50th Percentile) £75,000 £65,232 £67,500
Median % change year-on-year +14.97% -3.36% -
75th Percentile £93,778 £75,772 £84,292
90th Percentile £97,528 £94,693 £100,000
UK excluding London median annual salary £75,000 £61,250 £60,000
% change year-on-year +22.45% +2.08% +9.09%

All Process and Methodology Skills
UK

Continuous Deployment falls under the Processes and Methodologies category. For comparison with the information above, the following table provides summary statistics for all permanent job vacancies requiring process or methodology skills.

Permanent vacancies with a requirement for process or methodology skills 48,568 84,685 99,386
As % of all permanent jobs advertised in the UK 93.32% 85.99% 95.63%
Number of salaries quoted 26,511 59,837 58,366
10th Percentile £30,500 £29,000 £34,000
25th Percentile £42,500 £40,000 £45,000
Median annual salary (50th Percentile) £57,500 £55,000 £61,500
Median % change year-on-year +4.55% -10.57% +2.50%
75th Percentile £76,009 £72,500 £82,500
90th Percentile £98,750 £92,500 £100,000
UK excluding London median annual salary £52,500 £50,000 £55,000
% change year-on-year +5.00% -9.09% +4.76%

Continuous Deployment
Job Vacancy Trend

Job postings citing Continuous Deployment as a proportion of all IT jobs advertised.

Job vacancy trend for Continuous Deployment in the UK

Continuous Deployment
Salary Trend

3-month moving average salary quoted in jobs citing Continuous Deployment.

Salary trend for Continuous Deployment in the UK

Continuous Deployment
Salary Histogram

Salary distribution for jobs citing Continuous Deployment over the 6 months to 1 May 2025.

Salary histogram for Continuous Deployment in the UK

Continuous Deployment
Top 16 Job Locations

The table below looks at the demand and provides a guide to the median salaries quoted in IT jobs citing Continuous Deployment within the UK over the 6 months to 1 May 2025. The 'Rank Change' column provides an indication of the change in demand within each location based on the same 6 month period last year.

Location Rank Change
on Same Period
Last Year
Matching
Permanent
IT Job Ads
Median Salary
Past 6 Months
Median Salary
% Change
on Same Period
Last Year
Live
Jobs
England +11 163 £79,500 +22.31% 139
UK excluding London +58 135 £75,000 +22.45% 86
London +94 66 £80,000 +3.23% 80
Work from Home +15 54 £66,000 +10.00% 91
North of England +17 32 £88,662 +35.43% 19
Midlands +82 29 £72,500 +11.54% 9
Scotland +137 28 £66,000 -30.26% 7
West Midlands +41 20 £72,500 +11.54% 8
North West -2 19 £88,662 +36.40% 8
South West +58 18 £77,500 +29.17% 8
South East +66 16 £62,500 +8.70% 25
Yorkshire +55 13 £94,637 +34.09% 7
Wales - 9 £52,592 - 8
East Midlands - 9 - - 1
Northern Ireland - 3 - - 3
East of England +41 1 £70,000 +19.15% 9

Continuous Deployment
Co-occurring Skills and Capabilities by Category

The follow tables expand on the table above by listing co-occurrences grouped by category. The same employment type, locality and period is covered with up to 20 co-occurrences shown in each of the following categories:

Application Platforms
1 34 (16.43%) Confluence
2 7 (3.38%) SAS
3 4 (1.93%) Apache
3 4 (1.93%) Apache Airflow
4 3 (1.45%) SharePoint
5 1 (0.48%) CICS
Applications
1 2 (0.97%) Microsoft Office
1 2 (0.97%) Microsoft Project
2 1 (0.48%) S-PLUS
Business Applications
1 4 (1.93%) Oracle BPM
2 2 (0.97%) Oracle Subledger Accounting
3 1 (0.48%) Dynamics NAV
Cloud Services
1 87 (42.03%) AWS
2 84 (40.58%) Azure
3 41 (19.81%) GCP
4 31 (14.98%) Azure DevOps
5 23 (11.11%) GitHub
6 19 (9.18%) Serverless
7 13 (6.28%) Amazon S3
7 13 (6.28%) PaaS
8 11 (5.31%) AWS Lambda
8 11 (5.31%) GitHub Actions
8 11 (5.31%) SaaS
9 10 (4.83%) AWS CloudFormation
9 10 (4.83%) Azure Machine Learning
10 9 (4.35%) IaaS
11 7 (3.38%) Amazon EC2
11 7 (3.38%) Azure Data Factory
12 6 (2.90%) Azure Functions
12 6 (2.90%) Azure Monitor
12 6 (2.90%) Cloud Computing
12 6 (2.90%) Pulumi
Communications & Networking
1 9 (4.35%) Modbus
1 9 (4.35%) TCP/IP
2 8 (3.86%) Firewall
3 4 (1.93%) HTTP
3 4 (1.93%) VPN
4 3 (1.45%) Internet
5 2 (0.97%) Network Security
5 2 (0.97%) WAN
6 1 (0.48%) Cisco IOS
6 1 (0.48%) IOS XR
6 1 (0.48%) MPLS
6 1 (0.48%) Software-Defined Networking
Database & Business Intelligence
1 35 (16.91%) Relational Database
2 29 (14.01%) MySQL
3 20 (9.66%) NoSQL
4 19 (9.18%) PostgreSQL
5 10 (4.83%) Cloud Spanner
6 8 (3.86%) Amazon RDS
7 7 (3.38%) SQL Server
8 5 (2.42%) Azure SQL Database
9 4 (1.93%) MongoDB
10 3 (1.45%) Power BI
11 2 (0.97%) Apache Cassandra
11 2 (0.97%) Couchbase
11 2 (0.97%) Oracle Database
12 1 (0.48%) Azure SQL Data Warehouse
12 1 (0.48%) Data Lake
12 1 (0.48%) Data Warehouse
12 1 (0.48%) DB2
12 1 (0.48%) OLAP
12 1 (0.48%) SQL Server Reporting Services
Development Applications
1 57 (27.54%) Git
2 47 (22.71%) JIRA
3 34 (16.43%) Jenkins
4 27 (13.04%) Bitbucket
5 17 (8.21%) GitLab
6 12 (5.80%) Postman
6 12 (5.80%) Selenium
7 8 (3.86%) Visual Studio
8 7 (3.38%) Octopus Deploy
9 4 (1.93%) Fiddler
9 4 (1.93%) Liquibase
9 4 (1.93%) TeamCity
9 4 (1.93%) Visual Studio Code
10 3 (1.45%) Cypress.io
11 2 (0.97%) Appium
11 2 (0.97%) IBM UrbanCode
11 2 (0.97%) JUnit
11 2 (0.97%) Oracle Forms
11 2 (0.97%) TestNG
12 1 (0.48%) Gradle
General
1 57 (27.54%) Finance
2 53 (25.60%) Social Skills
3 27 (13.04%) Analytical Skills
4 25 (12.08%) Banking
5 12 (5.80%) Inclusion and Diversity
6 7 (3.38%) Legal
7 6 (2.90%) Financial Institution
8 5 (2.42%) Retail
9 4 (1.93%) Front Office
9 4 (1.93%) Public Sector
10 3 (1.45%) Law
11 2 (0.97%) General Ledger
11 2 (0.97%) Health Technology
12 1 (0.48%) Automotive
12 1 (0.48%) Aviation
12 1 (0.48%) Manufacturing
12 1 (0.48%) Marketing
12 1 (0.48%) Presentation Skills
Job Titles
1 68 (32.85%) Senior
2 46 (22.22%) Software Engineer
3 30 (14.49%) Senior Software Engineer
4 29 (14.01%) Developer
5 22 (10.63%) Lead
5 22 (10.63%) Systems Engineer
6 17 (8.21%) Architect
6 17 (8.21%) DevOps Engineer
7 16 (7.73%) IT Engineer
8 14 (6.76%) Solutions Architect
9 9 (4.35%) Auditor
9 9 (4.35%) Embedded Engineer
9 9 (4.35%) Embedded Firmware Engineer
9 9 (4.35%) Firmware Engineer
9 9 (4.35%) Security Auditor
9 9 (4.35%) Senior Auditor
9 9 (4.35%) Senior Embedded Engineer
9 9 (4.35%) Senior Firmware Engineer
10 8 (3.86%) Cloud Engineer
11 7 (3.38%) Full-Stack Developer
Libraries, Frameworks & Software Standards
1 47 (22.71%) .NET
2 31 (14.98%) React
2 31 (14.98%) RESTful
3 16 (7.73%) CSS
3 16 (7.73%) Node.js
4 12 (5.80%) JSON
4 12 (5.80%) Spring Boot
5 11 (5.31%) .NET Framework
5 11 (5.31%) HTML
6 10 (4.83%) Kafka
6 10 (4.83%) REST
7 9 (4.35%) Middleware
7 9 (4.35%) Playwright
7 9 (4.35%) Web Services
8 8 (3.86%) .NET Core
8 8 (3.86%) Tailwind CSS
8 8 (3.86%) XML
9 7 (3.38%) AngularJS
9 7 (3.38%) ASP.NET Web API
9 7 (3.38%) Bootstrap
Miscellaneous
1 22 (10.63%) Product Ownership
2 20 (9.66%) Public Cloud
3 17 (8.21%) Algorithms
3 17 (8.21%) Management Information System
4 10 (4.83%) Cloud Native
5 9 (4.35%) Device Driver
6 8 (3.86%) Credit Risk
6 8 (3.86%) Data Structures
6 8 (3.86%) Distributed Systems
6 8 (3.86%) Market Risk
7 5 (2.42%) Low-Code
7 5 (2.42%) Virtual Team
8 4 (1.93%) Client/Server
8 4 (1.93%) IVR
8 4 (1.93%) N-Tier
8 4 (1.93%) Private Cloud
9 3 (1.45%) Cloud Security Posture
9 3 (1.45%) Data Protection Act
9 3 (1.45%) Machine to Machine
9 3 (1.45%) Security Posture
Operating Systems
1 45 (21.74%) Linux
2 30 (14.49%) Windows
3 9 (4.35%) Embedded Linux
4 6 (2.90%) Android
4 6 (2.90%) Apple iOS
5 2 (0.97%) Red Hat Enterprise Linux
5 2 (0.97%) Windows Server
6 1 (0.48%) Amazon Linux
6 1 (0.48%) Unix
6 1 (0.48%) VMS
6 1 (0.48%) zOS
Processes & Methodologies
1 180 (86.96%) CI/CD
2 157 (75.85%) Continuous Integration
3 123 (59.42%) Agile
4 95 (45.89%) DevOps
5 56 (27.05%) Software Engineering
6 55 (26.57%) Coaching
7 53 (25.60%) Test Automation
8 49 (23.67%) Containerisation
9 42 (20.29%) Mentoring
10 38 (18.36%) Infrastructure as Code
10 38 (18.36%) Scrum
11 37 (17.87%) Microservices
12 32 (15.46%) DevSecOps
13 31 (14.98%) Problem-Solving
14 28 (13.53%) Deployment Automation
15 25 (12.08%) Risk Management
16 23 (11.11%) Continuous Improvement
16 23 (11.11%) Stakeholder Management
16 23 (11.11%) User Experience
17 21 (10.14%) Design Patterns
Programming Languages
1 50 (24.15%) C#
1 50 (24.15%) Python
2 36 (17.39%) Java
3 34 (16.43%) TypeScript
4 31 (14.98%) JavaScript
5 28 (13.53%) SQL
6 15 (7.25%) Go
7 12 (5.80%) C++
8 9 (4.35%) C
8 9 (4.35%) PowerShell
9 8 (3.86%) Bash
10 7 (3.38%) R
11 4 (1.93%) Ruby
12 3 (1.45%) Groovy
13 2 (0.97%) Bicep
13 2 (0.97%) PHP
13 2 (0.97%) PL/SQL
13 2 (0.97%) Rust
14 1 (0.48%) Perl
14 1 (0.48%) Shell Script
Qualifications
1 29 (14.01%) BPSS Clearance
2 24 (11.59%) Degree
3 18 (8.70%) Security Cleared
4 14 (6.76%) Computer Science Degree
5 12 (5.80%) SC Cleared
6 8 (3.86%) Master's Degree
7 5 (2.42%) Cisco Certification
7 5 (2.42%) CISSP
7 5 (2.42%) DV Cleared
8 3 (1.45%) (ISC)2 CCSP
8 3 (1.45%) Azure Certification
8 3 (1.45%) CCSP
9 2 (0.97%) CCNP
9 2 (0.97%) Microsoft Certification
10 1 (0.48%) CSQE
10 1 (0.48%) Numerate Degree
10 1 (0.48%) SANS
Quality Assurance & Compliance
1 14 (6.76%) QA
2 12 (5.80%) GDPR
3 8 (3.86%) Accessibility
3 8 (3.86%) Basel III
3 8 (3.86%) IFRS
3 8 (3.86%) IFRS 9
4 7 (3.38%) Basel II
4 7 (3.38%) Dodd-Frank
4 7 (3.38%) PCI DSS
5 3 (1.45%) ISO/IEC 27001
5 3 (1.45%) NIST
5 3 (1.45%) SOC 2
6 1 (0.48%) Disclosure Scotland
6 1 (0.48%) ISO 9001
6 1 (0.48%) PMO
System Software
1 46 (22.22%) Docker
2 9 (4.35%) Embedded Firmware
2 9 (4.35%) Firmware
3 3 (1.45%) Active Directory
4 1 (0.48%) Slurm Workload Manager
4 1 (0.48%) Virtual Desktop
4 1 (0.48%) Virtual Machines
4 1 (0.48%) VMware Infrastructure
Systems Management
1 64 (30.92%) Kubernetes
2 42 (20.29%) Terraform
3 40 (19.32%) Ansible
4 10 (4.83%) Grafana
5 8 (3.86%) Progress Chef
6 3 (1.45%) Kibana
6 3 (1.45%) Puppet
7 2 (0.97%) Packer
7 2 (0.97%) Single Sign-On
8 1 (0.48%) Microsoft Intune
8 1 (0.48%) Prometheus
Vendors
1 30 (14.49%) Atlassian
2 18 (8.70%) Microsoft
3 13 (6.28%) Google
4 6 (2.90%) Hitachi
4 6 (2.90%) IBM
4 6 (2.90%) Oracle
5 5 (2.42%) ServiceNow
6 4 (1.93%) IBM Sterling
7 3 (1.45%) Alibaba
8 2 (0.97%) ForgeRock
8 2 (0.97%) Ping Identity
8 2 (0.97%) Planview
8 2 (0.97%) VMware
9 1 (0.48%) AppDynamics
9 1 (0.48%) CA Agile Central
9 1 (0.48%) Cisco
9 1 (0.48%) Citrix
9 1 (0.48%) Juniper
9 1 (0.48%) Palo Alto
9 1 (0.48%) Red Hat