Hybrid/Remote Driving Licence Job Trends

Drivers' Licence
UK > Work from Home

The table below looks at the prevalence of the term Driving Licence in remote or hybrid work. Included is a benchmarking guide to the salaries offered in vacancies that cited Driving Licence over the 6 months leading up to 26 November 2025, comparing them to the same period in the previous two years.

6 months to
26 Nov 2025
Same period 2024 Same period 2023
Rank 160 256 282
Rank change year-on-year +96 +26 +211
Permanent jobs citing Driving Licence 242 228 222
As % of all permanent jobs with remote/hybrid work options 1.59% 1.15% 1.06%
As % of the Miscellaneous category 4.45% 3.13% 2.70%
Number of salaries quoted 193 119 192
10th Percentile £27,600 £28,200 £25,750
25th Percentile £30,000 £30,000 £27,500
Median annual salary (50th Percentile) £37,500 £32,500 £33,500
Median % change year-on-year +15.38% -2.99% -11.84%
75th Percentile £50,500 £45,750 £46,511
90th Percentile £58,750 £52,500 £57,500
UK median annual salary £35,000 £37,500 £32,500
% change year-on-year -6.67% +15.38% -9.72%

All Generic Skills
Work from Home

Driving Licence falls under the General and Transferable Skills category. For comparison with the information above, the following table provides summary statistics for all permanent job vacancies with remote or hybrid options requiring generic IT skills.

Permanent vacancies with a requirement for generic IT skills 5,437 7,274 8,219
As % of all permanent jobs with a WFH option 35.66% 36.60% 39.07%
Number of salaries quoted 3,551 4,167 6,448
10th Percentile £27,750 £36,250 £37,500
25th Percentile £38,750 £46,713 £48,750
Median annual salary (50th Percentile) £57,500 £62,500 £65,000
Median % change year-on-year -8.00% -3.85% -
75th Percentile £81,250 £85,000 £83,750
90th Percentile £110,000 £115,000 £102,500
UK median annual salary £54,939 £60,000 £62,500
% change year-on-year -8.44% -4.00% -

Driving Licence
Job Vacancy Trend for Remote/Hybrid Jobs

Historical trend showing the proportion of permanent IT job postings citing Driving Licence and offering remote or hybrid work options relative to all permanent IT jobs advertised.
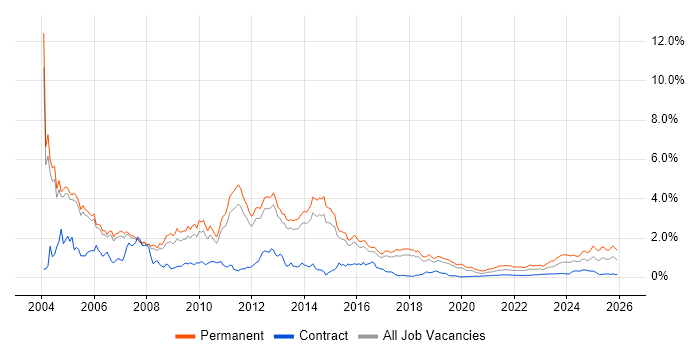
Driving Licence job vacancy trend for remote/hybrid jobs

Driving Licence
Salary Trend for Remote/Hybrid Jobs

Salary distribution trend for jobs with remote/hybrid work options citing Driving Licence.

Salary distribution trend for jobs with remote/hybrid work options citing Driving Licence

Driving Licence
Salary Histogram for Remote/Hybrid Jobs

Salary distribution for jobs with remote/hybrid work options citing Driving Licence over the 6 months to 26 November 2025.

Driving Licence salary histogram for jobs with remote/hybrid work options

Driving Licence
Co-Occurring Skills & Capabilities in Remote/Hybrid Jobs by Category

The following tables expand on the one above by listing co-occurrences grouped by category. They cover the same employment type, locality and period, with up to 20 co-occurrences shown in each category:

Application Platforms
1 35 (14.46%) SharePoint
2 30 (12.40%) Microsoft Exchange
3 1 (0.41%) ArcGIS
Applications
1 12 (4.96%) Microsoft Office
2 11 (4.55%) Microsoft Excel
3 3 (1.24%) AutoCAD
3 3 (1.24%) Microsoft PowerPoint
4 2 (0.83%) Microsoft Project
5 1 (0.41%) Civil 3D
5 1 (0.41%) Navisworks
5 1 (0.41%) Photoshop
5 1 (0.41%) Revit
Business Applications
1 7 (2.89%) Dynamics CRM
2 3 (1.24%) Oracle ERP
3 1 (0.41%) Magento
3 1 (0.41%) Sage 200
3 1 (0.41%) Shopify
Cloud Services
1 88 (36.36%) Microsoft 365
2 64 (26.45%) Azure
3 36 (14.88%) Entra ID
4 18 (7.44%) AWS
5 12 (4.96%) SaaS
6 10 (4.13%) Power Platform
7 6 (2.48%) OneDrive
8 5 (2.07%) IaaS
8 5 (2.07%) Power Automate
8 5 (2.07%) Salesforce Service Cloud
9 4 (1.65%) Google Workspace
10 3 (1.24%) Dynamics 365
11 2 (0.83%) Azure AI
11 2 (0.83%) Azure DevOps
11 2 (0.83%) Cloud Computing
11 2 (0.83%) Google Ads
11 2 (0.83%) Google Analytics
11 2 (0.83%) Microsoft Copilot
11 2 (0.83%) Mimecast
11 2 (0.83%) PowerApps
Communications & Networking
1 38 (15.70%) VPN
2 33 (13.64%) Firewall
3 31 (12.81%) DHCP
4 29 (11.98%) DNS
5 20 (8.26%) VoIP
6 18 (7.44%) TCP/IP
7 13 (5.37%) VLAN
7 13 (5.37%) WAN
8 9 (3.72%) LAN
9 7 (2.89%) IP Telephony
9 7 (2.89%) Remote Desktop
9 7 (2.89%) Wireless
10 5 (2.07%) DMZ
10 5 (2.07%) SD-WAN
10 5 (2.07%) STUN
10 5 (2.07%) Wi-Fi
11 4 (1.65%) BGP
11 4 (1.65%) Internet
11 4 (1.65%) Network Security
12 3 (1.24%) DKIM
Database & Business Intelligence
1 9 (3.72%) SQL Server
2 6 (2.48%) Power BI
3 3 (1.24%) Big Data
4 1 (0.41%) Crystal Reports
4 1 (0.41%) Data Lake
4 1 (0.41%) Geospatial Data
4 1 (0.41%) GIS
4 1 (0.41%) Power Query
Development Applications
1 3 (1.24%) RStudio
General
1 109 (45.04%) Social Skills
2 27 (11.16%) Analytical Skills
3 23 (9.50%) Inclusion and Diversity
4 20 (8.26%) Finance
5 18 (7.44%) Retail
5 18 (7.44%) Telecoms
6 17 (7.02%) Marketing
6 17 (7.02%) Organisational Skills
7 16 (6.61%) Manufacturing
8 14 (5.79%) Presentation Skills
9 10 (4.13%) Advertising
9 10 (4.13%) Documentation Skills
9 10 (4.13%) Law
9 10 (4.13%) Legal
10 6 (2.48%) Public Sector
11 5 (2.07%) Automotive
11 5 (2.07%) Local Government
11 5 (2.07%) Police
12 4 (1.65%) German Language
12 4 (1.65%) Military
Job Titles
1 62 (25.62%) IT Support
2 53 (21.90%) Support Engineer
3 33 (13.64%) IT Engineer
4 30 (12.40%) IT Support Engineer
5 28 (11.57%) Analyst
6 25 (10.33%) Technical Engineer
7 24 (9.92%) Senior
8 21 (8.68%) 2nd Line Support
9 20 (8.26%) Technical Support
9 20 (8.26%) Technical Support Engineer
10 19 (7.85%) 1st Line Support
10 19 (7.85%) IT Analyst
11 17 (7.02%) Support Analyst
12 16 (6.61%) Support Technician
13 15 (6.20%) IT Support Analyst
14 12 (4.96%) 2nd Line Engineer
14 12 (4.96%) 2nd Line Support Engineer
15 11 (4.55%) Applications Support
15 11 (4.55%) IT Support Technician
15 11 (4.55%) IT Technician
Libraries, Frameworks & Software Standards
1 7 (2.89%) .NET
2 5 (2.07%) EDI
2 5 (2.07%) FreeSWITCH
3 2 (0.83%) Oracle Fusion
3 2 (0.83%) SAML
4 1 (0.41%) JSON
4 1 (0.41%) XML
Miscellaneous
1 28 (11.57%) Onboarding
2 18 (7.44%) Self-Motivation
3 17 (7.02%) CCTV
4 13 (5.37%) Management Information System
5 9 (3.72%) EPoS
5 9 (3.72%) Social Media
6 7 (2.89%) Hybrid Cloud
6 7 (2.89%) iPad
7 6 (2.48%) FMCG
7 6 (2.48%) IoT
8 5 (2.07%) Enterprise Software
9 4 (1.65%) Analytical Mindset
9 4 (1.65%) Client/Server
9 4 (1.65%) Digital Media
9 4 (1.65%) Life Science
9 4 (1.65%) Machine to Machine
9 4 (1.65%) NHS
9 4 (1.65%) Operational Technology
9 4 (1.65%) Web Conferencing
10 3 (1.24%) SCADA
Operating Systems
1 91 (37.60%) Windows
2 51 (21.07%) Windows Server
3 24 (9.92%) Windows 10
4 20 (8.26%) Linux
5 13 (5.37%) Mac OS
6 8 (3.31%) Apple iOS
7 6 (2.48%) Debian
8 5 (2.07%) Mac OS X
9 4 (1.65%) Android
10 2 (0.83%) Windows Server 2012
10 2 (0.83%) Windows Server 2016
10 2 (0.83%) Windows Server 2019
11 1 (0.41%) OpenWrt
11 1 (0.41%) Windows 7
Processes & Methodologies
1 68 (28.10%) Problem-Solving
2 40 (16.53%) Customer Service
3 34 (14.05%) ITIL
4 30 (12.40%) Cybersecurity
5 24 (9.92%) Continuous Improvement
6 22 (9.09%) CRM
7 21 (8.68%) ERP
7 21 (8.68%) Project Delivery
8 19 (7.85%) Change Management
8 19 (7.85%) Mentoring
9 18 (7.44%) ITSM
10 17 (7.02%) Service Management
11 15 (6.20%) Business Development
11 15 (6.20%) Project Management
12 14 (5.79%) Stakeholder Management
13 13 (5.37%) B2B
13 13 (5.37%) Migration
14 12 (4.96%) Asset Management
14 12 (4.96%) Decision-Making
15 11 (4.55%) Collaborative Working
Programming Languages
1 23 (9.50%) SQL
2 9 (3.72%) PowerShell
3 5 (2.07%) T-SQL
4 4 (1.65%) Python
5 2 (0.83%) C#
5 2 (0.83%) PL/SQL
6 1 (0.41%) C
6 1 (0.41%) C++
6 1 (0.41%) Data Analysis Expressions
6 1 (0.41%) Java
Qualifications
1 52 (21.49%) Degree
2 21 (8.68%) Microsoft Certification
3 18 (7.44%) MCP
3 18 (7.44%) Security Cleared
4 15 (6.20%) Cisco Certification
5 14 (5.79%) MCSA
6 13 (5.37%) CCNA
6 13 (5.37%) MCSE
7 11 (4.55%) Computer Science Degree
8 10 (4.13%) SC Cleared
9 9 (3.72%) CCNP
10 7 (2.89%) A+ Certification
10 7 (2.89%) NVQ Level 3
11 5 (2.07%) HNC
11 5 (2.07%) HND
12 4 (1.65%) City & Guilds
13 3 (1.24%) BPSS Clearance
13 3 (1.24%) Chartered Engineer
13 3 (1.24%) DBS Check
13 3 (1.24%) DV Cleared
Quality Assurance & Compliance
1 14 (5.79%) Cyber Essentials
2 10 (4.13%) ISO 9001
2 10 (4.13%) ISO/IEC 27001
3 7 (2.89%) GDPR
4 3 (1.24%) GRC
4 3 (1.24%) HAZOP
4 3 (1.24%) IEC 61131
4 3 (1.24%) ISO 14001
4 3 (1.24%) NEBOSH
4 3 (1.24%) QA
5 2 (0.83%) Cyber Essentials PLUS
5 2 (0.83%) PMO
6 1 (0.41%) ISO 19650
6 1 (0.41%) ISO 22301
6 1 (0.41%) NIST
System Software
1 67 (27.69%) Active Directory
2 16 (6.61%) Hyper-V
3 6 (2.48%) VMware Infrastructure
4 5 (2.07%) Kamailio
5 1 (0.41%) iptables
Systems Management
1 27 (11.16%) Microsoft Intune
2 6 (2.48%) SCCM
3 5 (2.07%) FortiGate
4 4 (1.65%) Autotask
4 4 (1.65%) Progress Chef
5 3 (1.24%) Functional Safety
6 2 (0.83%) Jamf Pro
6 2 (0.83%) PaperCut
6 2 (0.83%) Single Sign-On
7 1 (0.41%) Ansible
Vendors
1 94 (38.84%) Microsoft
2 17 (7.02%) Cisco
3 16 (6.61%) VMware
4 15 (6.20%) Apple
5 10 (4.13%) Datto
6 8 (3.31%) Freshdesk
6 8 (3.31%) Google
6 8 (3.31%) Meraki
6 8 (3.31%) Salesforce
7 7 (2.89%) Draytek
7 7 (2.89%) Mitel
7 7 (2.89%) Siemens
7 7 (2.89%) WatchGuard
8 6 (2.48%) HP
8 6 (2.48%) Sage
9 5 (2.07%) OpenText
9 5 (2.07%) Sophos
10 4 (1.65%) QAD
10 4 (1.65%) Ubiquiti
11 3 (1.24%) ConnectWise