IoT Jobs with Hybrid/Remote/WFH Options

IoT (Internet of Things, Internet of Everything)
UK > Work from Home

The table below looks at the prevalence of the term IoT in remote or hybrid work. Included is a benchmarking guide to the salaries offered in vacancies that cited IoT over the 6 months leading up to 16 July 2025, comparing them to the same period in the previous two years.

6 months to
16 Jul 2025
Same period 2024 Same period 2023
Rank 384 293 347
Rank change year-on-year -91 +54 -36
Permanent jobs citing IoT 91 331 292
As % of all permanent jobs with a WFH option 0.43% 1.01% 0.84%
As % of the Miscellaneous category 1.07% 2.92% 2.17%
Number of salaries quoted 65 265 231
10th Percentile £37,170 £35,000 £35,000
25th Percentile £47,500 £50,500 £45,000
Median annual salary (50th Percentile) £58,000 £60,000 £62,500
Median % change year-on-year -3.33% -4.00% -13.79%
75th Percentile £77,500 £71,250 £78,750
90th Percentile £96,250 £85,000 £88,750
UK median annual salary £60,000 £60,000 £64,500
% change year-on-year - -6.98% -7.86%

All Generic Skills
Work from Home

IoT falls under the General and Transferable Skills category. For comparison with the information above, the following table provides summary statistics for all permanent job vacancies with remote or hybrid options requiring generic IT skills.

Permanent vacancies with a requirement for generic IT skills 8,499 11,326 13,450
As % of all permanent jobs with a WFH option 40.33% 34.60% 38.70%
Number of salaries quoted 3,868 8,364 10,376
10th Percentile £31,250 £32,500 £39,438
25th Percentile £45,000 £43,750 £48,750
Median annual salary (50th Percentile) £65,000 £60,000 £65,000
Median % change year-on-year +8.33% -7.69% -
75th Percentile £85,000 £82,500 £85,000
90th Percentile £120,000 £112,500 £107,500
UK median annual salary £57,500 £55,000 £64,470
% change year-on-year +4.55% -14.69% +3.15%

IoT
Trend for Jobs with a WFH Option

Job vacancies with remote working options citing IoT as a proportion of all IT jobs advertised.
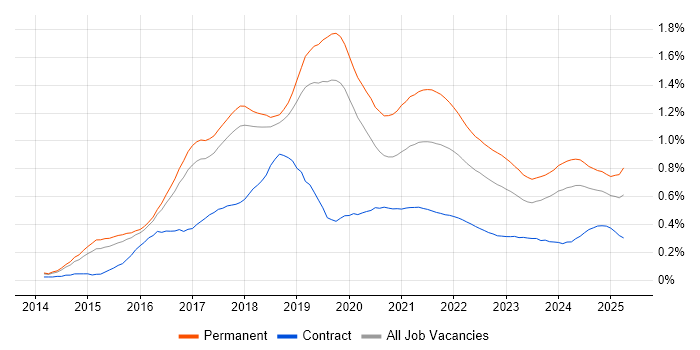
IoT trend for jobs with Hybrid/Remote/WFH options

IoT
Salary Trend for Jobs with a WFH Option

3-month moving average salary quoted in job vacancies with remote working options citing IoT.

IoT salary trend for jobs with a WFH option

IoT
Salary Histogram for Jobs with a WFH Option

Salary distribution for jobs with remote working options citing IoT over the 6 months to 16 July 2025.

IoT salary histogram for jobs with a WFH option

IoT
Co-occurring Skills and Capabilities with WFH Options by Category

The follow tables expand on the table above by listing co-occurrences grouped by category. The same employment type, locality and period is covered with up to 20 co-occurrences shown in each of the following categories:

Application Platforms
1 6 (6.59%) Confluence
2 3 (3.30%) ArcGIS
3 2 (2.20%) ThingWorx
4 1 (1.10%) Apache
4 1 (1.10%) Apache Airflow
Applications
1 6 (6.59%) Microsoft Excel
2 3 (3.30%) AutoCAD
2 3 (3.30%) Blender
2 3 (3.30%) ProjectWise
2 3 (3.30%) Revit
3 2 (2.20%) Simulink
Business Applications
1 8 (8.79%) SAP S/4HANA
2 3 (3.30%) SAP SCM
3 2 (2.20%) SAP APO
3 2 (2.20%) SAP EWM
3 2 (2.20%) SAP PP
4 1 (1.10%) Oracle ERP
4 1 (1.10%) Salesforce CRM
4 1 (1.10%) SAP IBP
4 1 (1.10%) SAP LE
4 1 (1.10%) SAP MM
4 1 (1.10%) SAP QM
4 1 (1.10%) SAP SD
4 1 (1.10%) SAP WM
Cloud Services
1 19 (20.88%) AWS
2 18 (19.78%) Azure
3 15 (16.48%) Microsoft 365
4 13 (14.29%) SaaS
5 9 (9.89%) IaaS
5 9 (9.89%) PaaS
6 5 (5.49%) Power Platform
7 4 (4.40%) Serverless
8 3 (3.30%) Amazon EC2
8 3 (3.30%) Virtual Private Cloud
9 2 (2.20%) Amazon S3
9 2 (2.20%) AWS CloudFormation
9 2 (2.20%) AWS CodeBuild
9 2 (2.20%) AWS CodeCommit
9 2 (2.20%) AWS CodeDeploy
9 2 (2.20%) AWS CodePipeline
9 2 (2.20%) Azure AKS
9 2 (2.20%) GCP
9 2 (2.20%) GitHub
10 1 (1.10%) Amazon ECR
Communications & Networking
1 9 (9.89%) Internet
2 8 (8.79%) DNS
3 7 (7.69%) WAN
4 6 (6.59%) LoRaWAN
4 6 (6.59%) Modbus
5 5 (5.49%) 4G
5 5 (5.49%) 5G
5 5 (5.49%) Unified Communications
6 4 (4.40%) MQTT
7 3 (3.30%) Broadband
7 3 (3.30%) LTE
7 3 (3.30%) Wireless
8 2 (2.20%) Network Security
8 2 (2.20%) TCP/IP
8 2 (2.20%) Wi-Fi
9 1 (1.10%) Ethernet
9 1 (1.10%) Firewall
9 1 (1.10%) GPRS
Database & Business Intelligence
1 7 (7.69%) MySQL
1 7 (7.69%) NoSQL
2 4 (4.40%) Power BI
2 4 (4.40%) SQL Server
3 3 (3.30%) Azure SQL Database
3 3 (3.30%) GIS
3 3 (3.30%) MongoDB
3 3 (3.30%) QGIS
3 3 (3.30%) Relational Database
4 2 (2.20%) BigQuery
4 2 (2.20%) PostgreSQL
5 1 (1.10%) Amazon Aurora
5 1 (1.10%) Amazon RDS
5 1 (1.10%) Data Lake
5 1 (1.10%) Data Warehouse
5 1 (1.10%) Pentaho
Development Applications
1 12 (13.19%) Git
2 10 (10.99%) JIRA
3 3 (3.30%) Jenkins
4 2 (2.20%) Eclipse
4 2 (2.20%) Subversion
5 1 (1.10%) Bitbucket
5 1 (1.10%) Cypress.io
5 1 (1.10%) Selenium
5 1 (1.10%) SonarQube
General
1 36 (39.56%) Social Skills
2 17 (18.68%) Finance
3 11 (12.09%) Public Sector
4 8 (8.79%) Manufacturing
4 8 (8.79%) Welsh Language
5 4 (4.40%) Analytical Skills
6 3 (3.30%) Marketing
6 3 (3.30%) Retail
6 3 (3.30%) Social Housing
6 3 (3.30%) Tech for Good
6 3 (3.30%) Telecoms
7 2 (2.20%) Advertising
7 2 (2.20%) Automotive
8 1 (1.10%) Agriculture
8 1 (1.10%) Electronics
8 1 (1.10%) Influencing Skills
8 1 (1.10%) Organisational Skills
8 1 (1.10%) Pharmaceutical
Job Titles
1 14 (15.38%) Developer
1 14 (15.38%) Software Engineer
2 13 (14.29%) Senior
3 12 (13.19%) Lead
4 8 (8.79%) Server Engineer
5 6 (6.59%) 1st Line Support
5 6 (6.59%) Account Manager
5 6 (6.59%) Consultant
5 6 (6.59%) SAP Consultant
5 6 (6.59%) Support Team Leader
5 6 (6.59%) Team Leader
6 5 (5.49%) Angular Developer
6 5 (5.49%) Embedded Engineer
6 5 (5.49%) Embedded Software Engineer
6 5 (5.49%) Full-Stack Developer
6 5 (5.49%) SAP EWM Consultant
6 5 (5.49%) SAP S/4HANA Consultant
7 4 (4.40%) Full-Stack .NET Developer
7 4 (4.40%) IoT Software Engineer
7 4 (4.40%) Senior SAP WM Consultant
Libraries, Frameworks & Software Standards
1 9 (9.89%) Node.js
2 8 (8.79%) AngularJS
2 8 (8.79%) React
3 7 (7.69%) Vue
4 6 (6.59%) .NET
4 6 (6.59%) .NET Core
4 6 (6.59%) SAP Fiori
5 3 (3.30%) gRPC
5 3 (3.30%) Kafka
5 3 (3.30%) Leaflet
5 3 (3.30%) PostGIS
5 3 (3.30%) REST
5 3 (3.30%) RESTful
5 3 (3.30%) SAPUI5
6 1 (1.10%) Elastic Stack
6 1 (1.10%) GraphQL
6 1 (1.10%) Playwright
6 1 (1.10%) PyTorch
6 1 (1.10%) scikit-learn
6 1 (1.10%) TensorFlow
Miscellaneous
1 9 (9.89%) Operational Technology
2 8 (8.79%) NHS
2 8 (8.79%) Smart City
2 8 (8.79%) Smart Meter
3 7 (7.69%) Management Information System
3 7 (7.69%) NB-IoT
4 6 (6.59%) Driving Licence
4 6 (6.59%) Smart Home
5 5 (5.49%) Cloud Native
5 5 (5.49%) Industrial Internet of Things
6 4 (4.40%) Mobile App
6 4 (4.40%) SCADA
6 4 (4.40%) Virtual Team
7 3 (3.30%) Embedded Systems
7 3 (3.30%) Onboarding
7 3 (3.30%) Raspberry Pi
7 3 (3.30%) Robotics
7 3 (3.30%) Self-Motivation
8 2 (2.20%) Distributed Systems
8 2 (2.20%) Product Ownership
Operating Systems
1 10 (10.99%) Windows
2 8 (8.79%) Linux
2 8 (8.79%) Windows Server
3 2 (2.20%) Unix
4 1 (1.10%) Debian
Processes & Methodologies
1 25 (27.47%) Agile
1 25 (27.47%) Problem-Solving
2 21 (23.08%) Mentoring
2 21 (23.08%) Software Engineering
3 15 (16.48%) Project Management
4 14 (15.38%) Continuous Improvement
4 14 (15.38%) DevOps
4 14 (15.38%) Microservices
5 13 (14.29%) Stakeholder Management
6 12 (13.19%) Project Delivery
6 12 (13.19%) Service Management
7 11 (12.09%) Analytics
7 11 (12.09%) CI/CD
7 11 (12.09%) Data Science
7 11 (12.09%) Incident Management
7 11 (12.09%) ITIL
8 10 (10.99%) Customer Service
8 10 (10.99%) Data Management
9 9 (9.89%) Data Collection
9 9 (9.89%) Roadmaps
Programming Languages
1 24 (26.37%) Python
2 10 (10.99%) C#
2 10 (10.99%) SQL
3 8 (8.79%) C
3 8 (8.79%) TypeScript
4 6 (6.59%) C++
5 4 (4.40%) PHP
6 3 (3.30%) Go
6 3 (3.30%) R
6 3 (3.30%) Ruby
7 2 (2.20%) Bicep
7 2 (2.20%) Embedded C
7 2 (2.20%) Java
7 2 (2.20%) MATLAB
8 1 (1.10%) Bash
8 1 (1.10%) Kotlin
Qualifications
1 19 (20.88%) Degree
2 8 (8.79%) Azure Certification
2 8 (8.79%) DBS Check
2 8 (8.79%) MCSA
2 8 (8.79%) MCSE
2 8 (8.79%) Microsoft Certification
3 7 (7.69%) Security Cleared
4 6 (6.59%) Computer Science Degree
5 4 (4.40%) Master's Degree
5 4 (4.40%) PMI Certification
5 4 (4.40%) PMP
5 4 (4.40%) SC Cleared
6 3 (3.30%) SAP Certification
7 2 (2.20%) PhD
8 1 (1.10%) MBA
8 1 (1.10%) Postgraduate
8 1 (1.10%) TOGAF Certification
Quality Assurance & Compliance
1 14 (15.38%) SLA
2 2 (2.20%) GDPR
3 1 (1.10%) Data Quality
3 1 (1.10%) QA
System Software
1 12 (13.19%) Docker
2 8 (8.79%) Active Directory
2 8 (8.79%) Virtual Desktop
3 4 (4.40%) Firmware
4 1 (1.10%) Virtual Machines
4 1 (1.10%) VMware Infrastructure
Systems Management
1 8 (8.79%) Kubernetes
2 4 (4.40%) Terraform
Vendors
1 18 (19.78%) Microsoft
2 13 (14.29%) SAP
3 3 (3.30%) Autodesk
3 3 (3.30%) Oracle
4 2 (2.20%) Atlassian
4 2 (2.20%) Atmel
4 2 (2.20%) Salesforce
4 2 (2.20%) Workday
5 1 (1.10%) Allen-Bradley
5 1 (1.10%) Ariba
5 1 (1.10%) DataCore
5 1 (1.10%) Google
5 1 (1.10%) Informatica
5 1 (1.10%) New Relic
5 1 (1.10%) Red Hat
5 1 (1.10%) Siemens
5 1 (1.10%) Sparx
5 1 (1.10%) VMware
5 1 (1.10%) YouTube