Hybrid/Remote ServiceNow Job Trends

ServiceNow
UK > Work from Home

The table below provides summary statistics for permanent remote or hybrid work requiring knowledge or experience of ServiceNow products and/or services. It includes a benchmarking guide to the annual salaries offered in vacancies that cited ServiceNow over the 6 months leading up to 6 November 2025, comparing them to the same period in the previous two years.

The figures below represent the IT labour market in general and are not representative of salaries within ServiceNow.

6 months to
6 Nov 2025
Same period 2024 Same period 2023
Rank 149 184 175
Rank change year-on-year +35 -9 +109
Permanent jobs citing ServiceNow 329 360 434
As % of all permanent jobs with remote/hybrid work options 2.08% 1.81% 1.99%
As % of the Vendors category 4.17% 4.97% 4.90%
Number of salaries quoted 169 264 373
10th Percentile £38,200 £31,250 £36,174
25th Percentile £50,000 £41,250 £48,500
Median annual salary (50th Percentile) £65,000 £59,715 £65,000
Median % change year-on-year +8.85% -8.13% +8.33%
75th Percentile £80,000 £76,250 £85,000
90th Percentile £86,250 £96,250 £97,500
UK median annual salary £65,000 £59,430 £56,525
% change year-on-year +9.37% +5.14% +2.99%

All Vendors
Work from Home

ServiceNow falls under the Vendor Products and Services category. For comparison with the information above, the following table provides summary statistics for all permanent job vacancies with a remote or hybrid options requiring knowledge or experience of all vendor products and services.

Permanent vacancies with a requirement for knowledge or experience of vendor products and services 7,888 7,244 8,861
As % of all permanent jobs with a WFH option 49.75% 36.49% 40.55%
Number of salaries quoted 3,663 4,310 7,252
10th Percentile £29,000 £32,500 £33,750
25th Percentile £37,500 £43,750 £45,000
Median annual salary (50th Percentile) £55,000 £60,000 £60,000
Median % change year-on-year -8.33% - +4.35%
75th Percentile £75,000 £77,500 £77,500
90th Percentile £90,000 £93,750 £92,500
UK median annual salary £50,000 £57,500 £55,000
% change year-on-year -13.04% +4.55% -3.51%

ServiceNow
Job Vacancy Trend for Remote/Hybrid Jobs

Historical trend showing the proportion of permanent IT job postings citing ServiceNow and offering remote or hybrid work options relative to all permanent IT jobs advertised.
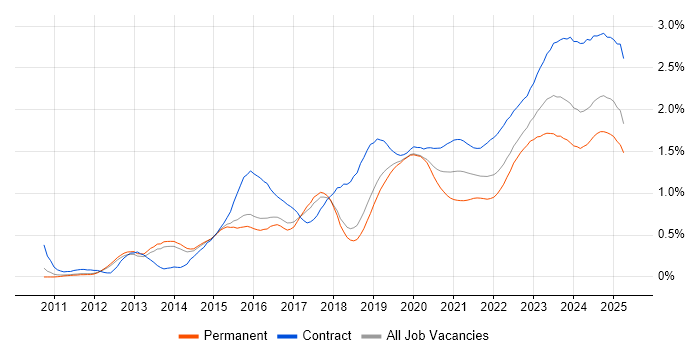
ServiceNow job vacancy trend for remote/hybrid jobs

ServiceNow
Salary Trend for Remote/Hybrid Jobs

Salary distribution trend for jobs with remote/hybrid work options citing ServiceNow.

Salary distribution trend for jobs with remote/hybrid work options citing ServiceNow

ServiceNow
Salary Histogram for Remote/Hybrid Jobs

Salary distribution for jobs with remote/hybrid work options citing ServiceNow over the 6 months to 6 November 2025.

ServiceNow salary histogram for jobs with remote/hybrid work options

ServiceNow
Co-Occurring Skills & Capabilities in Remote/Hybrid Jobs by Category

The following tables expand on the one above by listing co-occurrences grouped by category. They cover the same employment type, locality and period, with up to 20 co-occurrences shown in each category:

Application Platforms
1 10 (3.04%) Tomcat
1 10 (3.04%) WebSphere
1 10 (3.04%) WebSphere Application Server
2 6 (1.82%) IIS
2 6 (1.82%) SharePoint
3 1 (0.30%) Confluence
3 1 (0.30%) Oracle Workflow
Applications
1 103 (31.31%) Microsoft Office
2 16 (4.86%) Microsoft Excel
3 7 (2.13%) Microsoft PowerPoint
4 4 (1.22%) Chatbot
5 2 (0.61%) Microsoft Project
5 2 (0.61%) MS Visio
Business Applications
1 14 (4.26%) Remedy ITSM
2 8 (2.43%) Workday HCM
3 4 (1.22%) NetSuite
4 2 (0.61%) Sage X3
5 1 (0.30%) assyst
5 1 (0.30%) Integrated Workplace Management System
5 1 (0.30%) Salesforce CRM
Cloud Services
1 103 (31.31%) Microsoft 365
2 100 (30.40%) AWS
3 27 (8.21%) Azure
4 16 (4.86%) SaaS
5 10 (3.04%) Azure DevOps
6 8 (2.43%) Azure Logic Apps
6 8 (2.43%) Boomi
7 5 (1.52%) Azure Cosmos DB
7 5 (1.52%) GitHub
8 4 (1.22%) Power Platform
9 3 (0.91%) Entra ID
10 2 (0.61%) Azure Data Factory
10 2 (0.61%) Dynamics 365
10 2 (0.61%) GitHub Actions
10 2 (0.61%) Intacct
11 1 (0.30%) Azure AKS
11 1 (0.30%) Azure Monitor
11 1 (0.30%) GCP
11 1 (0.30%) iPaaS
11 1 (0.30%) Microsoft Purview
Communications & Networking
1 10 (3.04%) SSL
2 6 (1.82%) DHCP
2 6 (1.82%) DNS
2 6 (1.82%) TCP/IP
3 4 (1.22%) Broadband
3 4 (1.22%) SNMP
4 3 (0.91%) VPN
5 2 (0.61%) Wireless
6 1 (0.30%) Network Security
6 1 (0.30%) Remote Desktop
6 1 (0.30%) Skype
6 1 (0.30%) WebEx
Database & Business Intelligence
1 11 (3.34%) PostgreSQL
2 10 (3.04%) DB2
3 6 (1.82%) SQL Server
4 5 (1.52%) Metadata
4 5 (1.52%) MongoDB
5 3 (0.91%) Relational Database
6 2 (0.61%) Power BI
7 1 (0.30%) Azure SQL Database
7 1 (0.30%) Data Lake
7 1 (0.30%) GIS
7 1 (0.30%) Tableau
Development Applications
1 19 (5.78%) JIRA
2 5 (1.52%) Git
General
1 196 (59.57%) Social Skills
2 92 (27.96%) French Language
3 86 (26.14%) Swedish Language
4 58 (17.63%) Finance
5 37 (11.25%) Banking
6 28 (8.51%) Law
7 23 (6.99%) Analytical Skills
7 23 (6.99%) Legal
8 17 (5.17%) Public Sector
9 10 (3.04%) Investment Banking
10 8 (2.43%) Back Office
11 7 (2.13%) Inclusion and Diversity
12 6 (1.82%) Games
13 5 (1.52%) Hungarian Language
14 4 (1.22%) Spanish Language
15 3 (0.91%) Advertising
15 3 (0.91%) Billing
15 3 (0.91%) Retail
15 3 (0.91%) Telecoms
16 1 (0.30%) Manufacturing
Job Titles
1 105 (31.91%) Analyst
2 95 (28.88%) Service Analyst
3 94 (28.57%) Service Desk Analyst
4 55 (16.72%) Senior
5 47 (14.29%) Consultant
6 35 (10.64%) Developer
6 35 (10.64%) ServiceNow Developer
7 31 (9.42%) Technical Consultant
8 27 (8.21%) Senior Consultant
9 24 (7.29%) Senior Technical Consultant
10 17 (5.17%) ServiceNow Consultant
11 15 (4.56%) Architect
11 15 (4.56%) HR Advisor
12 12 (3.65%) Applications Support
12 12 (3.65%) Senior Developer
12 12 (3.65%) Senior ServiceNow Developer
13 10 (3.04%) HR Specialist
13 10 (3.04%) Infrastructure Support
13 10 (3.04%) Lead
13 10 (3.04%) Software Manager
Libraries, Frameworks & Software Standards
1 17 (5.17%) REST
1 17 (5.17%) SOAP
2 16 (4.86%) XML
3 15 (4.56%) JSON
4 14 (4.26%) CSS
4 14 (4.26%) HTML
5 11 (3.34%) LDAP
6 10 (3.04%) LAPP Stack
6 10 (3.04%) Web Services
6 10 (3.04%) WebSphere MQ
7 8 (2.43%) SAML
8 5 (1.52%) YAML
9 2 (0.61%) AngularJS
10 1 (0.30%) .NET
10 1 (0.30%) .NET Core
10 1 (0.30%) EDI
10 1 (0.30%) OpenTelemetry
Miscellaneous
1 33 (10.03%) Onboarding
2 19 (5.78%) Management Information System
3 15 (4.56%) Product Ownership
4 13 (3.95%) CMDB
5 12 (3.65%) Linux Command Line
6 8 (2.43%) Operational Technology
7 6 (1.82%) Analytical Mindset
7 6 (1.82%) Hybrid Cloud
8 5 (1.52%) AI Agents
9 3 (0.91%) Data Centre
9 3 (0.91%) Foreign Exchange (FX)
9 3 (0.91%) Legacy Systems
9 3 (0.91%) Video\Live Streaming
10 2 (0.61%) Blackberry
10 2 (0.61%) Low-Code
10 2 (0.61%) Mobile App
10 2 (0.61%) Self-Motivation
11 1 (0.30%) Cyber Threat
11 1 (0.30%) Enterprise Software
11 1 (0.30%) IoT
Operating Systems
1 29 (8.81%) Windows
2 12 (3.65%) Linux
3 10 (3.04%) Red Hat Enterprise Linux
3 10 (3.04%) Unix
4 8 (2.43%) Windows 10
5 7 (2.13%) Windows Server
6 2 (0.61%) Android
6 2 (0.61%) Apple iOS
Processes & Methodologies
1 197 (59.88%) ITSM
2 192 (58.36%) ITIL
3 107 (32.52%) Customer Service
4 92 (27.96%) Performance Metrics
5 53 (16.11%) Problem-Solving
6 48 (14.59%) Continuous Improvement
7 36 (10.94%) Asset Management
8 35 (10.64%) Service Delivery
9 32 (9.73%) Service Management
10 30 (9.12%) Mentoring
11 29 (8.81%) Agile
11 29 (8.81%) Change Management
11 29 (8.81%) Roadmaps
12 28 (8.51%) Decision-Making
13 21 (6.38%) IT Asset Management
13 21 (6.38%) Problem Management
14 20 (6.08%) CRM
14 20 (6.08%) Data Entry
15 19 (5.78%) Coaching
16 17 (5.17%) Technical Leadership
Programming Languages
1 37 (11.25%) JavaScript
2 18 (5.47%) Python
3 14 (4.26%) PowerShell
4 10 (3.04%) SQL
5 6 (1.82%) C#
6 1 (0.30%) VB.NET
Qualifications
1 122 (37.08%) Degree
2 96 (29.18%) AWS Certification
3 90 (27.36%) Microsoft Certification
4 86 (26.14%) MCSE
5 16 (4.86%) ITIL Certification
6 15 (4.56%) Security Cleared
7 8 (2.43%) SC Cleared
8 5 (1.52%) CIPD
8 5 (1.52%) Computer Science Degree
9 4 (1.22%) ITIL Foundation Certificate
10 3 (0.91%) BPSS Clearance
10 3 (0.91%) PRINCE2 Practitioner
11 1 (0.30%) CBAP
11 1 (0.30%) HND
11 1 (0.30%) PMI Certification
11 1 (0.30%) PMP
11 1 (0.30%) Postgraduate
11 1 (0.30%) SAFe Agilist
11 1 (0.30%) Six Sigma Green Belt
11 1 (0.30%) Six Sigma Yellow Belt
Quality Assurance & Compliance
1 94 (28.57%) QA
2 26 (7.90%) GDPR
3 17 (5.17%) SLA
4 5 (1.52%) PMO
5 4 (1.22%) COBIT
5 4 (1.22%) GRC
5 4 (1.22%) ISO/IEC 20000
6 3 (0.91%) ISO/IEC 27001
6 3 (0.91%) NCSC
6 3 (0.91%) Sarbanes-Oxley
7 2 (0.61%) Data Quality
7 2 (0.61%) NIST
8 1 (0.30%) Accessibility
8 1 (0.30%) ISO/IEC 19770
8 1 (0.30%) ISO/IEC 27002 (supersedes ISO/IEC 17799)
8 1 (0.30%) NIST 800
8 1 (0.30%) SOC 2
System Software
1 14 (4.26%) Active Directory
2 1 (0.30%) Docker
Systems Management
1 9 (2.74%) Single Sign-On
2 6 (1.82%) SCCM
3 5 (1.52%) Kubernetes
4 4 (1.22%) Microsoft Intune
5 2 (0.61%) AirWatch
6 1 (0.30%) RSA Archer
Vendors
1 122 (37.08%) Microsoft
2 37 (11.25%) Workday
3 14 (4.26%) BMC
3 14 (4.26%) Remedy
4 10 (3.04%) IBM
4 10 (3.04%) Red Hat
5 9 (2.74%) Snow
6 8 (2.43%) MuleSoft
7 7 (2.13%) Dynatrace
8 6 (1.82%) Freshdesk
8 6 (1.82%) Oracle
9 5 (1.52%) Citrix
9 5 (1.52%) Salesforce
10 4 (1.22%) Genesys
11 2 (0.61%) Adobe
11 2 (0.61%) Apple
11 2 (0.61%) iManage
11 2 (0.61%) Sage
11 2 (0.61%) Samsung
11 2 (0.61%) SolarWinds