webMethods Contract Job Trends

webMethods
UK

The table below provides summary statistics for contract job vacancies requiring knowledge or experience of webMethods products and/or services. It includes a benchmarking guide to contractor rates offered in vacancies that cited webMethods over the 6 months leading up to 25 November 2025, comparing them to the same period in the previous two years.

The figures below represent the IT contractor job market in general and are not representative of contractor rates within webMethods, Inc.

6 months to
25 Nov 2025
Same period 2024 Same period 2023
Rank 539 560 613
Rank change year-on-year +21 +53 +106
Contract jobs citing webMethods 52 12 7
As % of all contract jobs in the UK 0.15% 0.033% 0.015%
As % of the Vendors category 0.31% 0.073% 0.033%
Number of daily rates quoted 37 10 7
10th Percentile £362 £406 £525
25th Percentile £427 £434 £567
Median daily rate (50th Percentile) £505 £435 £618
Median % change year-on-year +16.09% -29.55% +14.35%
75th Percentile £680 £659 £643
90th Percentile £688 £689 £675
UK excluding London median daily rate £429 £435 £626
% change year-on-year -1.38% -30.54% +15.97%

All Vendors
UK

webMethods falls under the Vendor Products and Services category. For comparison with the information above, the following table provides summary statistics for all contract job vacancies requiring knowledge or experience of all vendor products and services.

Contract vacancies with a requirement for knowledge or experience of vendor products and services 17,012 16,336 20,907
As % of all contract IT jobs advertised in the UK 47.52% 44.98% 45.38%
Number of daily rates quoted 10,735 9,609 13,380
10th Percentile £288 £297 £256
25th Percentile £405 £413 £406
Median daily rate (50th Percentile) £500 £525 £525
Median % change year-on-year -4.76% - -1.41%
75th Percentile £610 £625 £638
90th Percentile £700 £720 £725
UK excluding London median daily rate £492 £500 £500
% change year-on-year -1.60% - +1.01%
Number of hourly rates quoted 870 523 672
10th Percentile £15.34 £15.49 £15.25
25th Percentile £18.50 £19.48 £20.00
Median hourly rate £25.15 £30.00 £44.50
Median % change year-on-year -16.18% -32.58% +73.08%
75th Percentile £42.50 £63.75 £63.91
90th Percentile £73.75 £75.00 £76.73
UK excluding London median hourly rate £22.32 £27.50 £44.50
% change year-on-year -18.85% -38.20% +97.78%

webMethods
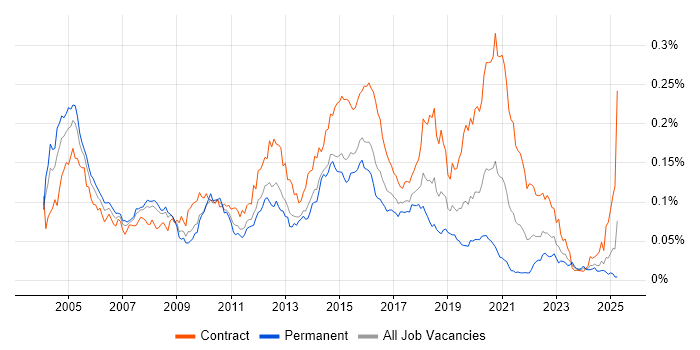
Job Vacancy Trend

Historical trend showing the proportion of contract IT job postings citing webMethods relative to all contract IT jobs advertised.

webMethods job vacancy trend in the UK

webMethods
Daily Rate Trend

Contractor daily rate distribution trend for jobs in the UK citing webMethods.

Contractor daily rate distribution trend for jobs in the UK citing webMethods

webMethods
Daily Rate Histogram

Daily rate distribution for jobs citing webMethods over the 6 months to 25 November 2025.

Daily rate histogram for webMethods in the UK

webMethods
Hourly Rate Trend

Contractor hourly rate distribution trend for jobs in the UK citing webMethods.

Contractor hourly rate distribution trend for jobs in the UK citing webMethods

webMethods
Top 10 Contract Job Locations

The table below looks at the demand and provides a guide to the median contractor rates quoted in IT jobs citing webMethods within the UK over the 6 months to 25 November 2025. The 'Rank Change' column provides an indication of the change in demand within each location based on the same 6 month period last year.

Location Rank Change
on Same Period
Last Year
Matching
Contract
IT Job Ads
Median
Daily Rate
Past 6 Months
Median Daily Rate
% Change
on Same Period
Last Year
Live
Jobs
England +20 47 £505 +16.09% 6
Work from Home +35 29 £625 +43.68% 6
UK excluding London -17 21 £429 -1.38% 4
London +21 14 £625 - 2
West Midlands -15 11 £429 -1.29%
Midlands -26 11 £429 -1.29%
South East -7 5 £375 -13.79% 1
North West - 5 £660 - 3
North of England - 5 £660 - 3
South West - 1 £625 -

webMethods
Co-Occurring Skills & Capabilities by Category

The following tables expand on the one above by listing co-occurrences grouped by category. They cover the same employment type, locality and period, with up to 20 co-occurrences shown in each category:
Application Platforms
1 13 (25.00%) WebLogic
2 9 (17.31%) Apache
2 9 (17.31%) JBoss
3 1 (1.92%) Tuxedo
Applications
1 1 (1.92%) Microsoft Project
1 1 (1.92%) MS Visio
Cloud Services
1 9 (17.31%) AWS
1 9 (17.31%) Cloud Computing
2 4 (7.69%) Tricentis Tosca
3 1 (1.92%) Microsoft 365
Communications & Networking
1 17 (32.69%) HTTPS
2 1 (1.92%) SSL
Database & Business Intelligence
1 9 (17.31%) MongoDB
2 1 (1.92%) Apache Cassandra
2 1 (1.92%) Relational Database
2 1 (1.92%) SQL Server
Development Applications
1 9 (17.31%) Eclipse
1 9 (17.31%) Git
1 9 (17.31%) IntelliJ
1 9 (17.31%) JUnit
1 9 (17.31%) Selenium
2 4 (7.69%) JIRA
2 4 (7.69%) Toad
3 1 (1.92%) SoapUI
General
1 18 (34.62%) Social Skills
2 9 (17.31%) Influencing Skills
3 7 (13.46%) Public Sector
4 3 (5.77%) Analytical Skills
4 3 (5.77%) Documentation Skills
5 2 (3.85%) Finance
Job Titles
1 37 (71.15%) Developer
2 33 (63.46%) webMethods Developer
3 6 (11.54%) Analyst
4 4 (7.69%) Java Engineer
4 4 (7.69%) Test Analyst
5 3 (5.77%) Administrator
5 3 (5.77%) SAP Analyst
5 3 (5.77%) SAP Test Analyst
5 3 (5.77%) Software Engineer
5 3 (5.77%) webMethods Administrator
6 2 (3.85%) Business Analyst
6 2 (3.85%) Java Developer
6 2 (3.85%) Tester
7 1 (1.92%) ERP Project Manager
7 1 (1.92%) Junior Developer
7 1 (1.92%) Junior webMethods Developer
7 1 (1.92%) Open Source Developer
7 1 (1.92%) Open Source Engineer
7 1 (1.92%) Senior Test Analyst
7 1 (1.92%) Supply Chain Analyst
Libraries, Frameworks & Software Standards
1 31 (59.62%) XML
2 27 (51.92%) JSON
3 26 (50.00%) SOAP
4 16 (30.77%) JMS
5 13 (25.00%) REST
6 10 (19.23%) Spring
7 9 (17.31%) EJB
7 9 (17.31%) Hibernate
7 9 (17.31%) HTML
7 9 (17.31%) HTML5
7 9 (17.31%) J2EE
7 9 (17.31%) J2SE
7 9 (17.31%) Play Framework
8 5 (9.62%) Middleware
8 5 (9.62%) Web Services
9 1 (1.92%) OAuth
9 1 (1.92%) Spring Boot
9 1 (1.92%) Swagger
9 1 (1.92%) WireMock
9 1 (1.92%) XML Messaging
Miscellaneous
1 1 (1.92%) Data Structures
1 1 (1.92%) Legacy Systems
1 1 (1.92%) Onboarding
1 1 (1.92%) Self-Motivation
Operating Systems
1 10 (19.23%) Unix
2 3 (5.77%) Windows
3 1 (1.92%) Linux
Processes & Methodologies
1 26 (50.00%) DevOps
2 24 (46.15%) Deployment Automation
3 22 (42.31%) Test Automation
4 15 (28.85%) Problem-Solving
5 14 (26.92%) Agile
6 12 (23.08%) CI/CD
7 10 (19.23%) Scrum
8 9 (17.31%) Continuous Delivery
8 9 (17.31%) Continuous Improvement
8 9 (17.31%) Continuous Integration
8 9 (17.31%) Infrastructure as Code
8 9 (17.31%) Infrastructure Automation
8 9 (17.31%) Lean Software Development
8 9 (17.31%) Mentoring
8 9 (17.31%) Microservices
8 9 (17.31%) Open Source
8 9 (17.31%) Software Engineering
9 7 (13.46%) API Management
10 5 (9.62%) Change Control
10 5 (9.62%) Integration Patterns
Programming Languages
1 15 (28.85%) SQL
2 14 (26.92%) Java
3 10 (19.23%) Scala
4 1 (1.92%) Bash
4 1 (1.92%) C
4 1 (1.92%) Korn
4 1 (1.92%) PL/SQL
4 1 (1.92%) R
4 1 (1.92%) Shell Script
Qualifications
1 35 (67.31%) Security Cleared
2 31 (59.62%) SC Cleared
3 6 (11.54%) BPSS Clearance
4 5 (9.62%) ISEB
4 5 (9.62%) ISTQB Foundation Certification
5 4 (7.69%) ISTQB
6 2 (3.85%) Degree
7 1 (1.92%) Computer Science Degree
7 1 (1.92%) ISEB Practitioner
Quality Assurance & Compliance
1 1 (1.92%) QA
System Software
1 9 (17.31%) Docker
Systems Management
1 9 (17.31%) Puppet
Vendors
1 20 (38.46%) SAP
2 15 (28.85%) Axway
3 13 (25.00%) Software AG
4 12 (23.08%) IBM
5 4 (7.69%) Oracle
6 2 (3.85%) Microsoft
6 2 (3.85%) TIBCO
7 1 (1.92%) Compaq
7 1 (1.92%) HP
7 1 (1.92%) ServiceNow
7 1 (1.92%) Terracotta
7 1 (1.92%) Trillium