Computer Science Contracts with Hybrid/Remote/WFH Options

Computer Science
UK > Work from Home

The table below provides summary statistics for remote or hybrid contract work requiring Computer Science skills. It includes a benchmarking guide to the contractor rates offered in vacancies that cited Computer Science over the 6 months leading up to 3 July 2025, comparing them to the same period in the previous two years.

6 months to
3 Jul 2025
Same period 2024 Same period 2023
Rank 80 69 121
Rank change year-on-year -11 +52 +35
Contract jobs citing Computer Science 316 430 485
As % of all contract jobs with a WFH option 3.14% 2.93% 2.03%
As % of the Processes & Methodologies category 3.43% 3.36% 2.27%
Number of daily rates quoted 197 271 286
10th Percentile £324 £329 £388
25th Percentile £409 £425 £481
Median daily rate (50th Percentile) £550 £538 £550
Median % change year-on-year +2.23% -2.18% -8.33%
75th Percentile £725 £688 £743
90th Percentile £775 £775 £875
UK median daily rate £500 £535 £550
% change year-on-year -6.59% -2.68% -8.33%
Number of hourly rates quoted 3 33 22
10th Percentile £30.21 £51.50 £19.00
25th Percentile £36.04 £52.50 £19.37
Median hourly rate £54.50 £55.00 £37.50
Median % change year-on-year -0.91% +46.67% -23.47%
75th Percentile £66.71 £65.00 £64.69
90th Percentile £68.78 £71.00 £73.38
UK median hourly rate £30.50 £55.00 £55.00
% change year-on-year -44.55% - +18.28%

All Process and Methodology Skills
Work from Home

Computer Science falls under the Processes and Methodologies category. For comparison with the information above, the following table provides summary statistics for all contract job vacancies with remote or hybrid options requiring process or methodology skills.

Contract vacancies with a requirement for process or methodology skills 9,224 12,802 21,352
As % of all contract jobs with a WFH option 91.77% 87.21% 89.55%
Number of daily rates quoted 6,250 8,610 15,077
10th Percentile £325 £325 £358
25th Percentile £413 £425 £450
Median daily rate (50th Percentile) £513 £525 £540
Median % change year-on-year -2.38% -2.78% +0.93%
75th Percentile £638 £638 £650
90th Percentile £760 £750 £750
UK median daily rate £505 £525 £550
% change year-on-year -3.81% -4.55% +1.38%
Number of hourly rates quoted 259 551 508
10th Percentile £13.40 £15.17 £17.50
25th Percentile £19.09 £25.50 £25.75
Median hourly rate £35.00 £43.00 £52.50
Median % change year-on-year -18.60% -18.10% +31.25%
75th Percentile £65.00 £60.93 £67.50
90th Percentile £75.00 £75.00 £78.88
UK median hourly rate £25.15 £37.50 £36.00
% change year-on-year -32.93% +4.17% +38.46%

Computer Science
Trend for Jobs with a WFH Option

Job vacancies with remote working options citing Computer Science as a proportion of all IT jobs advertised.
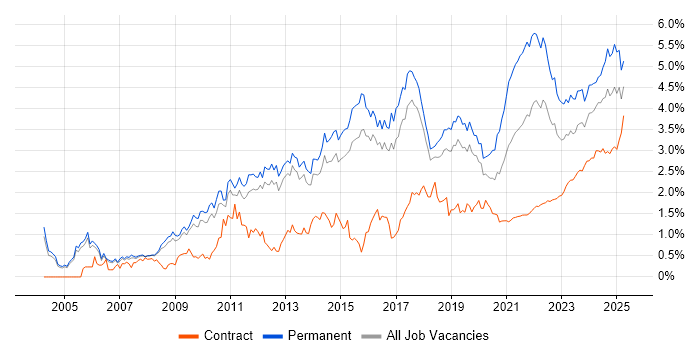
Computer Science trend for jobs with Hybrid/Remote/WFH options

Computer Science
Daily Rate Trend for Jobs with a WFH Option

3-month moving average daily rate quoted in job vacancies with remote working options citing Computer Science.

Computer Science daily rate for jobs with a WFH option

Computer Science
Daily Rate Histogram for Jobs with a WFH Option

Daily rate distribution for jobs with remote working options citing Computer Science over the 6 months to 3 July 2025.

Computer Science daily rate histogram for jobs with a WFH option

Computer Science
Hourly Rate Trend for Jobs with a WFH Option

3-month moving average hourly rate quoted in job vacancies with remote working options citing Computer Science.

Computer Science hourly rate for jobs with a WFH option

Computer Science
Hourly Rate Histogram for Jobs with a WFH Option

Hourly rate distribution for jobs with remote working options citing Computer Science over the 6 months to 3 July 2025.

Computer Science hourly rate histogram for jobs with a WFH option

Computer Science
Co-occurring Skills and Capabilities with WFH Options by Category

The follow tables expand on the table above by listing co-occurrences grouped by category. The same employment type, locality and period is covered with up to 20 co-occurrences shown in each of the following categories:

Application Platforms
1 18 (5.70%) Apache Spark
1 18 (5.70%) Confluence
2 8 (2.53%) GemFire
2 8 (2.53%) Oracle Coherence
3 7 (2.22%) SharePoint
4 6 (1.90%) CMS
5 4 (1.27%) OpenStack
6 3 (0.95%) Microsoft Exchange
7 2 (0.63%) Apache
7 2 (0.63%) JBoss
7 2 (0.63%) SAS
8 1 (0.32%) IBM Domino
8 1 (0.32%) ThingWorx
Applications
1 14 (4.43%) Microsoft Office
2 9 (2.85%) Microsoft Excel
3 6 (1.90%) MS Visio
4 2 (0.63%) Trello
5 1 (0.32%) InVision
5 1 (0.32%) Microsoft Project
5 1 (0.32%) Sketch
5 1 (0.32%) Spreadsheet
Business Applications
1 11 (3.48%) SAP S/4HANA
2 5 (1.58%) Workday HCM
3 4 (1.27%) Payment Gateway
3 4 (1.27%) SAP EWM
3 4 (1.27%) SAP PLM
4 3 (0.95%) SAP MDG
4 3 (0.95%) SAP VC
5 2 (0.63%) Dynamics CRM
5 2 (0.63%) Salesforce CRM
6 1 (0.32%) Dynamics AX
6 1 (0.32%) Endur
6 1 (0.32%) Maximo
6 1 (0.32%) NetSuite
6 1 (0.32%) Oracle EBS
6 1 (0.32%) Oracle EBS R12
6 1 (0.32%) SAP HCM
Cloud Services
1 83 (26.27%) Azure
2 80 (25.32%) AWS
3 25 (7.91%) GCP
4 24 (7.59%) Azure DevOps
5 13 (4.11%) Amazon S3
6 12 (3.80%) Power Platform
6 12 (3.80%) SaaS
7 11 (3.48%) Serverless
8 10 (3.16%) GitHub
9 9 (2.85%) Cloud Computing
10 8 (2.53%) AWS Lambda
10 8 (2.53%) Microsoft 365
11 7 (2.22%) Amazon EC2
11 7 (2.22%) Entra ID
12 6 (1.90%) PaaS
13 3 (0.95%) Amazon EMR
13 3 (0.95%) Amazon Kinesis
13 3 (0.95%) Dynamics 365
13 3 (0.95%) Kong
13 3 (0.95%) OpenShift
Communications & Networking
1 21 (6.65%) Firewall
2 15 (4.75%) TCP/IP
3 13 (4.11%) VPN
4 10 (3.16%) Network Security
5 7 (2.22%) BGP
5 7 (2.22%) DNS
5 7 (2.22%) OSPF
5 7 (2.22%) TACACS
5 7 (2.22%) VLAN
6 4 (1.27%) HTTP
7 3 (0.95%) LAN
7 3 (0.95%) WAN
8 2 (0.63%) 5G
8 2 (0.63%) Cisco ISE
8 2 (0.63%) Cisco Nexus
8 2 (0.63%) DWDM
8 2 (0.63%) Intrusion Detection
8 2 (0.63%) NAS
8 2 (0.63%) SSL
9 1 (0.32%) MQTT
Database & Business Intelligence
1 24 (7.59%) PostgreSQL
2 19 (6.01%) Redis
3 14 (4.43%) NoSQL
3 14 (4.43%) Relational Database
4 12 (3.80%) Data Warehouse
5 11 (3.48%) Power BI
6 10 (3.16%) Big Data
7 9 (2.85%) Hadoop
7 9 (2.85%) SQL Server
8 6 (1.90%) Oracle Database
8 6 (1.90%) Tableau
9 5 (1.58%) Amazon Redshift
9 5 (1.58%) Metadata
9 5 (1.58%) MySQL
10 4 (1.27%) Apache Cassandra
11 3 (0.95%) Apache Hive
11 3 (0.95%) Data Mining
11 3 (0.95%) KDB
11 3 (0.95%) Power Query
11 3 (0.95%) SQL Server Reporting Services
Development Applications
1 30 (9.49%) Git
2 27 (8.54%) JIRA
3 21 (6.65%) Jenkins
4 12 (3.80%) GitLab
5 5 (1.58%) Postman
6 4 (1.27%) REST Assured
7 3 (0.95%) Cypress.io
7 3 (0.95%) IntelliJ
7 3 (0.95%) Maven
7 3 (0.95%) Subversion
8 2 (0.63%) Artifactory
8 2 (0.63%) Browser DevTools
8 2 (0.63%) JMeter
8 2 (0.63%) JUnit
8 2 (0.63%) MLflow
8 2 (0.63%) Selenium
8 2 (0.63%) Sonatype Nexus
8 2 (0.63%) Toad
8 2 (0.63%) Vite
8 2 (0.63%) webpack
General
1 200 (63.29%) Social Skills
2 123 (38.92%) Analytical Skills
3 70 (22.15%) Finance
4 36 (11.39%) Banking
5 33 (10.44%) Public Sector
6 23 (7.28%) Marketing
7 20 (6.33%) Investment Banking
8 15 (4.75%) Front Office
8 15 (4.75%) Inclusion and Diversity
8 15 (4.75%) Presentation Skills
9 10 (3.16%) Telecoms
10 8 (2.53%) Manufacturing
10 8 (2.53%) Military
11 5 (1.58%) Documentation Skills
11 5 (1.58%) Legal
11 5 (1.58%) Pharmaceutical
12 4 (1.27%) Electronics
12 4 (1.27%) Financial Institution
12 4 (1.27%) French Language
12 4 (1.27%) Retail
Job Titles
1 87 (27.53%) Developer
2 46 (14.56%) Senior
3 37 (11.71%) Java Developer
4 34 (10.76%) Architect
5 30 (9.49%) Lead
6 23 (7.28%) Analyst
7 16 (5.06%) Lead Developer
8 15 (4.75%) Lead Java Developer
9 14 (4.43%) Data Scientist
9 14 (4.43%) Senior Developer
10 13 (4.11%) Consultant
10 13 (4.11%) Python Developer
10 13 (4.11%) Software Engineer
11 11 (3.48%) Cloud Engineer
11 11 (3.48%) Solutions Architect
12 9 (2.85%) Cloud Architect
12 9 (2.85%) IT Manager
12 9 (2.85%) Virtualisation Engineer
13 8 (2.53%) C# Developer
13 8 (2.53%) Oracle Developer
Libraries, Frameworks & Software Standards
1 27 (8.54%) Kafka
2 20 (6.33%) .NET
3 18 (5.70%) ActiveMQ
3 18 (5.70%) AngularJS
3 18 (5.70%) REST
4 17 (5.38%) Spring
5 14 (4.43%) Pandas
6 13 (4.11%) CSS
7 11 (3.48%) HTML
7 11 (3.48%) React
7 11 (3.48%) RESTful
8 10 (3.16%) PyTorch
8 10 (3.16%) TensorFlow
9 9 (2.85%) ASP.NET
9 9 (2.85%) Flash
9 9 (2.85%) SOAP
10 7 (2.22%) .NET Framework
10 7 (2.22%) Node.js
10 7 (2.22%) scikit-learn
11 6 (1.90%) Jest
Miscellaneous
1 29 (9.18%) Management Information System
2 22 (6.96%) Algorithms
3 21 (6.65%) Cloud Native
4 18 (5.70%) Product Ownership
5 17 (5.38%) Data Structures
6 14 (4.43%) Distributed Systems
7 12 (3.80%) Analytical Mindset
7 12 (3.80%) Data Protection Act
8 10 (3.16%) Clustering
8 10 (3.16%) Enterprise Software
8 10 (3.16%) Foreign Exchange (FX)
9 8 (2.53%) Fixed Income
9 8 (2.53%) Virtual Team
10 7 (2.22%) Life Science
11 6 (1.90%) Multi-touch
12 5 (1.58%) Derivative
12 5 (1.58%) Hedge funds
12 5 (1.58%) Renewable Energy
12 5 (1.58%) Security Posture
12 5 (1.58%) SWIFT Messaging Network
Operating Systems
1 36 (11.39%) Linux
2 8 (2.53%) Windows
3 7 (2.22%) Unix
4 4 (1.27%) Android
4 4 (1.27%) SUSE
5 2 (0.63%) Apple iOS
5 2 (0.63%) Mac OS
5 2 (0.63%) Red Hat Enterprise Linux
5 2 (0.63%) Windows 10
Processes & Methodologies
1 151 (47.78%) Problem-Solving
2 107 (33.86%) Agile
3 71 (22.47%) DevOps
4 53 (16.77%) Mathematics
5 50 (15.82%) CI/CD
6 47 (14.87%) Software Engineering
7 44 (13.92%) Data Science
8 39 (12.34%) Analytics
9 36 (11.39%) Machine Learning
9 36 (11.39%) Validation
10 34 (10.76%) Project Management
11 30 (9.49%) TDD
12 29 (9.18%) Mentoring
12 29 (9.18%) Migration
13 28 (8.86%) Decision-Making
14 27 (8.54%) Scrum
15 25 (7.91%) Architectural Design
15 25 (7.91%) Cybersecurity
16 23 (7.28%) Test Automation
17 22 (6.96%) Data Protection
Programming Languages
1 100 (31.65%) Python
2 77 (24.37%) SQL
3 72 (22.78%) Java
4 21 (6.65%) Bash
5 19 (6.01%) C++
5 19 (6.01%) JavaScript
6 17 (5.38%) PowerShell
7 15 (4.75%) R
8 14 (4.43%) C#
9 8 (2.53%) Perl
10 5 (1.58%) F#
10 5 (1.58%) Scala
11 4 (1.27%) ABAP
11 4 (1.27%) Go
11 4 (1.27%) TypeScript
12 3 (0.95%) PHP
12 3 (0.95%) VBA
13 2 (0.63%) Apex Code
13 2 (0.63%) Kotlin
13 2 (0.63%) Ruby
Qualifications
1 296 (93.67%) Degree
2 181 (57.28%) Computer Science Degree
3 55 (17.41%) Master's Degree
4 28 (8.86%) Security Cleared
5 25 (7.91%) Numerate Degree
6 24 (7.59%) AWS Certification
7 23 (7.28%) SC Cleared
8 22 (6.96%) CISSP
9 21 (6.65%) Azure Certification
10 20 (6.33%) Cisco Certification
10 20 (6.33%) Microsoft Certification
10 20 (6.33%) PhD
11 18 (5.70%) CCNA
12 17 (5.38%) AWS Certified Solutions Architect
13 11 (3.48%) CISM
13 11 (3.48%) PMI Certification
13 11 (3.48%) PMP
14 9 (2.85%) VMware Certified Professional (VCP)
15 6 (1.90%) CCNP
15 6 (1.90%) ISTQB
Quality Assurance & Compliance
1 22 (6.96%) Data Quality
2 18 (5.70%) GDPR
3 14 (4.43%) ISO/IEC 27001
4 13 (4.11%) Accessibility
5 11 (3.48%) QA
6 10 (3.16%) NIST
7 6 (1.90%) California Consumer Privacy Act
7 6 (1.90%) Sarbanes-Oxley
8 5 (1.58%) PCI DSS
9 4 (1.27%) Actionable Recommendations
9 4 (1.27%) COBIT
9 4 (1.27%) HIPAA
9 4 (1.27%) SEPA
10 3 (0.95%) ISO/IEC 27005
10 3 (0.95%) NCSC
11 2 (0.63%) 21 CFR Part 11
11 2 (0.63%) Disclosure Scotland
11 2 (0.63%) ISO/IEC 27002 (supersedes ISO/IEC 17799)
11 2 (0.63%) WCAG
12 1 (0.32%) SLA
System Software
1 30 (9.49%) Docker
2 12 (3.80%) VMware Infrastructure
3 9 (2.85%) VMware ESXi
3 9 (2.85%) VMware NSX
4 8 (2.53%) GridGain
5 7 (2.22%) Active Directory
6 2 (0.63%) Apache ZooKeeper
7 1 (0.32%) BitLocker
7 1 (0.32%) Oracle RAC
7 1 (0.32%) Tivoli Workload Scheduler
7 1 (0.32%) Virtual Machines
Systems Management
1 37 (11.71%) Kubernetes
2 26 (8.23%) Terraform
3 21 (6.65%) Ansible
4 9 (2.85%) vCenter Server
5 7 (2.22%) Progress Chef
5 7 (2.22%) Prometheus
6 6 (1.90%) Argo
6 6 (1.90%) Grafana
7 4 (1.27%) Puppet
8 3 (0.95%) Control-M
8 3 (0.95%) Istio
8 3 (0.95%) Rundeck
9 2 (0.63%) Consul
9 2 (0.63%) Kubeflow
9 2 (0.63%) logstash
9 2 (0.63%) Microsoft Intune
9 2 (0.63%) SCCM
9 2 (0.63%) Single Sign-On
10 1 (0.32%) Oracle RMAN
10 1 (0.32%) Tivoli
Vendors
1 46 (14.56%) Microsoft
2 31 (9.81%) SAP
3 26 (8.23%) Oracle
4 20 (6.33%) Google
5 17 (5.38%) Cisco
6 12 (3.80%) VMware
7 10 (3.16%) Atlassian
7 10 (3.16%) Salesforce
7 10 (3.16%) ServiceNow
8 7 (2.22%) Databricks
8 7 (2.22%) Palo Alto
8 7 (2.22%) Splunk
9 5 (1.58%) Red Hat
9 5 (1.58%) Workday
10 3 (0.95%) Cloudera
10 3 (0.95%) Dynatrace
10 3 (0.95%) Informatica
11 2 (0.63%) CA Agile Central
11 2 (0.63%) CyberArk
11 2 (0.63%) F5