Onboarding Contracts with Hybrid/Remote/WFH Options

Onboarding
UK > Work from Home

The table below looks at the prevalence of the term Onboarding in remote or hybrid contract work. Included is a benchmarking guide to the contractor rates offered in vacancies that cited Onboarding over the 6 months leading up to 22 June 2025, comparing them to the same period in the previous two years.

6 months to
22 Jun 2025
Same period 2024 Same period 2023
Rank 98 165 160
Rank change year-on-year +67 -5 +46
Contract jobs citing Onboarding 261 190 374
As % of all contract jobs with a WFH option 2.67% 1.29% 1.57%
As % of the Miscellaneous category 7.80% 4.40% 4.98%
Number of daily rates quoted 175 123 259
10th Percentile £368 £310 £374
25th Percentile £422 £457 £500
Median daily rate (50th Percentile) £550 £536 £565
Median % change year-on-year +2.61% -5.13% +2.73%
75th Percentile £671 £588 £688
90th Percentile £788 £650 £738
UK median daily rate £537 £528 £550
% change year-on-year +1.80% -4.09% -
Number of hourly rates quoted 5 13 2
10th Percentile £17.41 - £66.45
25th Percentile £22.75 £14.00 £67.13
Median hourly rate £25.50 £23.45 £68.50
Median % change year-on-year +8.74% -65.77% +120.97%
75th Percentile £26.25 £30.25 £70.13
90th Percentile £57.00 - £70.95
UK median hourly rate £29.50 £22.48 £26.75
% change year-on-year +31.26% -15.98% +33.75%

All Generic Skills
Work from Home

Onboarding falls under the General and Transferable Skills category. For comparison with the information above, the following table provides summary statistics for all contract job vacancies with remote or hybrid options requiring generic IT skills.

Contract vacancies with a requirement for generic IT skills 3,348 4,316 7,508
As % of all contract jobs with a WFH option 34.23% 29.23% 31.57%
Number of daily rates quoted 2,199 2,921 5,324
10th Percentile £340 £325 £363
25th Percentile £413 £438 £456
Median daily rate (50th Percentile) £525 £550 £550
Median % change year-on-year -4.55% - -
75th Percentile £675 £675 £684
90th Percentile £825 £850 £800
UK median daily rate £525 £538 £550
% change year-on-year -2.42% -2.18% -
Number of hourly rates quoted 88 188 146
10th Percentile £16.00 £16.03 £19.00
25th Percentile £25.63 £25.50 £25.18
Median hourly rate £41.52 £48.25 £52.50
Median % change year-on-year -13.95% -8.10% +17.98%
75th Percentile £64.50 £70.00 £69.69
90th Percentile £79.13 £75.00 £75.00
UK median hourly rate £31.76 £35.65 £22.49
% change year-on-year -10.91% +58.55% -16.72%

Onboarding
Trend for Jobs with a WFH Option

Job vacancies with remote working options citing Onboarding as a proportion of all IT jobs advertised.
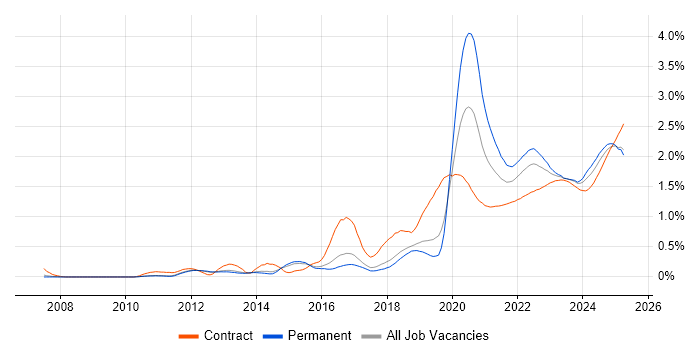
Onboarding trend for jobs with Hybrid/Remote/WFH options

Onboarding
Daily Rate Trend for Jobs with a WFH Option

3-month moving average daily rate quoted in job vacancies with remote working options citing Onboarding.

Onboarding daily rate for jobs with a WFH option

Onboarding
Daily Rate Histogram for Jobs with a WFH Option

Daily rate distribution for jobs with remote working options citing Onboarding over the 6 months to 22 June 2025.

Onboarding daily rate histogram for jobs with a WFH option

Onboarding
Hourly Rate Trend for Jobs with a WFH Option

3-month moving average hourly rate quoted in job vacancies with remote working options citing Onboarding.

Onboarding hourly rate for jobs with a WFH option

Onboarding
Hourly Rate Histogram for Jobs with a WFH Option

Hourly rate distribution for jobs with remote working options citing Onboarding over the 6 months to 22 June 2025.

Onboarding hourly rate histogram for jobs with a WFH option

Onboarding
Co-occurring Skills and Capabilities with WFH Options by Category

The follow tables expand on the table above by listing co-occurrences grouped by category. The same employment type, locality and period is covered with up to 20 co-occurrences shown in each of the following categories:

Application Platforms
1 11 (4.21%) SharePoint
2 6 (2.30%) Confluence
2 6 (2.30%) Microsoft Exchange
3 4 (1.53%) Oracle SOA Suite
4 3 (1.15%) Alfresco
4 3 (1.15%) Moodle
5 2 (0.77%) nginx
6 1 (0.38%) Apache
6 1 (0.38%) CMS
6 1 (0.38%) Tomcat
Applications
1 13 (4.98%) Microsoft Office
2 8 (3.07%) Microsoft Excel
3 4 (1.53%) Microsoft Project
4 1 (0.38%) Microsoft PowerPoint
4 1 (0.38%) MS Visio
4 1 (0.38%) Trello
Business Applications
1 19 (7.28%) Aladdin
1 19 (7.28%) thinkFolio
2 5 (1.92%) Dynamics CRM
3 4 (1.53%) SAP S/4HANA
4 2 (0.77%) Oracle Payables
5 1 (0.38%) Fidessa
5 1 (0.38%) SAP MDM
5 1 (0.38%) SAP PM
Cloud Services
1 34 (13.03%) Azure
2 28 (10.73%) AWS
3 16 (6.13%) SaaS
4 14 (5.36%) Microsoft 365
5 13 (4.98%) Amazon S3
6 12 (4.60%) Asana
6 12 (4.60%) Power Platform
7 11 (4.21%) Amazon EC2
7 11 (4.21%) Entra ID
8 8 (3.07%) Amazon SQS
9 7 (2.68%) Dynamics 365
9 7 (2.68%) Serverless
9 7 (2.68%) Slack
10 6 (2.30%) OCI
11 5 (1.92%) AWS Lambda
12 4 (1.53%) GitHub
12 4 (1.53%) OneDrive
12 4 (1.53%) Oracle CX
12 4 (1.53%) PaaS
12 4 (1.53%) Snowflake
Communications & Networking
1 8 (3.07%) Firewall
2 7 (2.68%) Network Security
3 6 (2.30%) BGP
4 5 (1.92%) VPN
5 4 (1.53%) Remote Desktop
5 4 (1.53%) SSH
6 3 (1.15%) HTTPS
7 2 (0.77%) F5 BIG-IP LTM
7 2 (0.77%) HTTP
7 2 (0.77%) Multicast
7 2 (0.77%) SSL
8 1 (0.38%) Cisco ISE
8 1 (0.38%) Cisco Nexus
8 1 (0.38%) DNS
8 1 (0.38%) NAS
8 1 (0.38%) POP3
8 1 (0.38%) SMTP
8 1 (0.38%) TCP/IP
8 1 (0.38%) Unified Communications
8 1 (0.38%) VLAN
Database & Business Intelligence
1 10 (3.83%) Power BI
2 8 (3.07%) Data Warehouse
3 4 (1.53%) Big Data
3 4 (1.53%) Data Lake
3 4 (1.53%) Metadata
3 4 (1.53%) Oracle Database
4 3 (1.15%) Amazon Redshift
4 3 (1.15%) PostgreSQL
4 3 (1.15%) SQL Server
5 2 (0.77%) Azure SQL Database
5 2 (0.77%) DB2
5 2 (0.77%) MongoDB
5 2 (0.77%) MySQL
5 2 (0.77%) NoSQL
5 2 (0.77%) Relational Database
6 1 (0.38%) Azure SQL Data Warehouse
6 1 (0.38%) Delta Lake
6 1 (0.38%) GIS
6 1 (0.38%) SAP Data Services
6 1 (0.38%) SQL Server Reporting Services
Development Applications
1 18 (6.90%) JIRA
2 12 (4.60%) Git
3 7 (2.68%) Jenkins
4 6 (2.30%) GitLab
5 4 (1.53%) Bitbucket
5 4 (1.53%) ScriptRunner
6 3 (1.15%) Visual Studio
7 2 (0.77%) Atlassian Bamboo
7 2 (0.77%) Cypress.io
7 2 (0.77%) Oracle Forms
7 2 (0.77%) TeamCity
7 2 (0.77%) Visual Studio Code
8 1 (0.38%) LSMW
8 1 (0.38%) Postman
General
1 85 (32.57%) Finance
2 76 (29.12%) Social Skills
3 27 (10.34%) Analytical Skills
4 26 (9.96%) Banking
5 23 (8.81%) Front Office
6 17 (6.51%) Public Sector
7 16 (6.13%) Marketing
8 12 (4.60%) Documentation Skills
8 12 (4.60%) Inclusion and Diversity
8 12 (4.60%) Manufacturing
9 10 (3.83%) Telecoms
10 9 (3.45%) Legal
11 7 (2.68%) Electronics
12 6 (2.30%) Financial Institution
12 6 (2.30%) Investment Banking
12 6 (2.30%) Organisational Skills
12 6 (2.30%) Presentation Skills
13 5 (1.92%) Retail
14 3 (1.15%) Billing
14 3 (1.15%) Law
Job Titles
1 54 (20.69%) Analyst
2 36 (13.79%) Business Analyst
3 27 (10.34%) Architect
4 24 (9.20%) Business Manager
4 24 (9.20%) Senior
5 23 (8.81%) Developer
6 22 (8.43%) Fixed Income Business Analyst
7 20 (7.66%) Consultant
8 18 (6.90%) Project Manager
9 16 (6.13%) Lead
10 9 (3.45%) Security Architect
11 8 (3.07%) IT Support
12 7 (2.68%) IT Engineer
12 7 (2.68%) IT Support Engineer
12 7 (2.68%) Splunk Engineer
12 7 (2.68%) Support Engineer
13 6 (2.30%) Administrator
13 6 (2.30%) Coordinator
13 6 (2.30%) Network Engineer
13 6 (2.30%) Trainer
Libraries, Frameworks & Software Standards
1 9 (3.45%) LDAP
2 6 (2.30%) SailPoint
3 5 (1.92%) .NET
3 5 (1.92%) EDI
3 5 (1.92%) Oracle Fusion
4 4 (1.53%) Middleware
4 4 (1.53%) OpenID
5 3 (1.15%) AngularJS
5 3 (1.15%) FastAPI
5 3 (1.15%) Kafka
5 3 (1.15%) React
5 3 (1.15%) Spring Boot
5 3 (1.15%) Web Services
6 2 (0.77%) AWS CDK
6 2 (0.77%) Compass CSS Framework
6 2 (0.77%) CSS
6 2 (0.77%) HTML
6 2 (0.77%) Redux
6 2 (0.77%) RxJS
6 2 (0.77%) SAML
Miscellaneous
1 23 (8.81%) Derivative
1 23 (8.81%) Fixed Income
2 22 (8.43%) Hedge funds
3 9 (3.45%) Security Operations Centre
4 8 (3.07%) CSOC
5 7 (2.68%) Data Protection Act
5 7 (2.68%) Product Ownership
5 7 (2.68%) Self-Motivation
6 6 (2.30%) Data Structures
7 5 (1.92%) Legacy Systems
7 5 (1.92%) Security Posture
8 4 (1.53%) Cloud Native
8 4 (1.53%) Management Information System
9 3 (1.15%) Data Centre
9 3 (1.15%) e-Learning
9 3 (1.15%) Learning Management System
9 3 (1.15%) Social Media
9 3 (1.15%) Video Editing
10 2 (0.77%) Enterprise Software
10 2 (0.77%) Virtual Team
Operating Systems
1 21 (8.05%) Windows
2 13 (4.98%) Linux
3 6 (2.30%) Unix
4 5 (1.92%) Android
4 5 (1.92%) Apple iOS
5 3 (1.15%) Red Hat Enterprise Linux
5 3 (1.15%) Windows 10
6 2 (0.77%) Amazon Linux
6 2 (0.77%) Windows Server
7 1 (0.38%) AIX
7 1 (0.38%) CentOS
7 1 (0.38%) Solaris
Processes & Methodologies
1 53 (20.31%) Agile
2 39 (14.94%) Client Onboarding
3 37 (14.18%) Business Intelligence
4 36 (13.79%) Problem-Solving
5 35 (13.41%) Project Management
6 32 (12.26%) Stakeholder Management
7 31 (11.88%) Asset Management
7 31 (11.88%) Business Analysis
8 28 (10.73%) Investment Management
9 25 (9.58%) DevOps
10 24 (9.20%) Data Mapping
11 22 (8.43%) Portfolio Management
12 20 (7.66%) Migration
13 17 (6.51%) SIEM
14 16 (6.13%) Analytics
15 15 (5.75%) Programme Management
15 15 (5.75%) Project Delivery
16 14 (5.36%) Cybersecurity
16 14 (5.36%) Use Case
17 13 (4.98%) Stakeholder Engagement
Programming Languages
1 45 (17.24%) Python
2 38 (14.56%) SQL
3 10 (3.83%) PowerShell
4 8 (3.07%) C#
4 8 (3.07%) Java
5 6 (2.30%) Bash
6 4 (1.53%) Groovy
6 4 (1.53%) TypeScript
7 2 (0.77%) ActionScript
7 2 (0.77%) ActionScript 2.0
7 2 (0.77%) Shell Script
7 2 (0.77%) T-SQL
8 1 (0.38%) C
8 1 (0.38%) JavaScript
8 1 (0.38%) Perl
8 1 (0.38%) PL/SQL
8 1 (0.38%) Ruby
8 1 (0.38%) Smalltalk
8 1 (0.38%) VB
8 1 (0.38%) VBScript
Qualifications
1 56 (21.46%) Security Cleared
2 35 (13.41%) SC Cleared
3 21 (8.05%) Degree
4 14 (5.36%) BPSS Clearance
5 7 (2.68%) DV Cleared
5 7 (2.68%) PMI Certification
6 6 (2.30%) AWS Certification
7 5 (1.92%) PMP
8 2 (0.77%) APMG
8 2 (0.77%) Azure Certification
8 2 (0.77%) CISSP
8 2 (0.77%) TOGAF Certification
9 1 (0.38%) (ISC)2 CCSP
9 1 (0.38%) APMP
9 1 (0.38%) CCDE
9 1 (0.38%) Cisco Certification
9 1 (0.38%) ITIL Foundation Certificate
9 1 (0.38%) Microsoft Certification
9 1 (0.38%) OSCP
9 1 (0.38%) VCAP
Quality Assurance & Compliance
1 12 (4.60%) PMO
2 11 (4.21%) GDPR
3 6 (2.30%) NCSC
3 6 (2.30%) NIST
3 6 (2.30%) QA
4 5 (1.92%) Accessibility
4 5 (1.92%) Data Quality
5 4 (1.53%) HIPAA
5 4 (1.53%) ISO/IEC 27001
5 4 (1.53%) Sarbanes-Oxley
6 3 (1.15%) WCAG
7 2 (0.77%) EMIR
8 1 (0.38%) Cyber Essentials
8 1 (0.38%) GRC
8 1 (0.38%) GxP
8 1 (0.38%) MiFID
8 1 (0.38%) PCI DSS
8 1 (0.38%) SLA
System Software
1 20 (7.66%) Active Directory
2 5 (1.92%) Docker
3 4 (1.53%) VMware Infrastructure
4 2 (0.77%) Virtual Desktop
5 1 (0.38%) Firmware
5 1 (0.38%) Veritas Cluster Server
5 1 (0.38%) VMware ESXi
5 1 (0.38%) VMware NSX
5 1 (0.38%) vSphere
Systems Management
1 13 (4.98%) Terraform
2 6 (2.30%) Kubernetes
2 6 (2.30%) Microsoft Intune
3 5 (1.92%) Single Sign-On
4 3 (1.15%) Ansible
4 3 (1.15%) FortiGate
4 3 (1.15%) Grafana
4 3 (1.15%) MIIS
4 3 (1.15%) Prometheus
5 2 (0.77%) HP Quality Center
5 2 (0.77%) Kibana
5 2 (0.77%) Packer
6 1 (0.38%) Active Directory Federation Services
6 1 (0.38%) PowerCLI
6 1 (0.38%) Progress Chef
6 1 (0.38%) Puppet
6 1 (0.38%) QRadar
6 1 (0.38%) Salt
6 1 (0.38%) vCenter Server
6 1 (0.38%) VxRail
Vendors
1 34 (13.03%) Microsoft
2 23 (8.81%) Splunk
3 22 (8.43%) Charles River
4 19 (7.28%) BISAM
4 19 (7.28%) Calypso
4 19 (7.28%) SimCorp
5 17 (6.51%) SAP
6 14 (5.36%) Oracle
7 12 (4.60%) VMware
8 10 (3.83%) CyberArk
9 7 (2.68%) ServiceNow
10 5 (1.92%) Salesforce
10 5 (1.92%) Virgin Media
11 4 (1.53%) Ariba
11 4 (1.53%) Atlassian
11 4 (1.53%) IBM
11 4 (1.53%) Palo Alto
12 3 (1.15%) Adobe
12 3 (1.15%) Cisco
12 3 (1.15%) HP