Replication Jobs in London

Replication
England > London

The table below looks at the prevalence of the term Replication in permanent job vacancies advertised in London. Included is a benchmarking guide to the salaries offered in vacancies that have cited Replication over the 6 months to 10 May 2024 with a comparison to the same period over the previous 2 years.

6 months to
10 May 2024
Same period 2023 Same period 2022
Rank 401 491 660
Rank change year-on-year +90 +169 -154
Permanent jobs citing Replication 102 128 222
As % of all permanent jobs advertised in London 0.43% 0.37% 0.33%
As % of the Miscellaneous category 1.07% 0.81% 0.65%
Number of salaries quoted 92 104 116
10th Percentile £35,500 £31,250 £41,625
25th Percentile £45,313 £40,000 £50,000
Median annual salary (50th Percentile) £65,000 £57,500 £60,000
Median % change year-on-year +13.04% -4.17% +20.00%
75th Percentile £68,750 £67,500 £77,500
90th Percentile £102,500 £72,500 £85,000
England median annual salary £47,500 £52,500 £50,000
% change year-on-year -9.52% +5.00% +11.11%

All Generic Skills
London

Replication is in the General and Transferable Skills category. The following table is for comparison with the above and provides summary statistics for all permanent job vacancies advertised in London with a requirement for generic IT skills.

Permanent vacancies with a requirement for generic IT skills 9,545 15,832 33,962
As % of all permanent jobs advertised in London 40.40% 46.14% 50.34%
Number of salaries quoted 6,779 10,693 15,286
10th Percentile £37,500 £44,192 £45,000
25th Percentile £51,532 £56,219 £56,250
Median annual salary (50th Percentile) £75,000 £75,000 £75,000
Median % change year-on-year - - +3.45%
75th Percentile £100,000 £100,000 £96,250
90th Percentile £129,000 £122,500 £120,000
England median annual salary £55,000 £65,000 £62,500
% change year-on-year -15.38% +4.00% +4.17%

Replication
Job Vacancy Trend in London

Job postings citing Replication as a proportion of all IT jobs advertised in London.
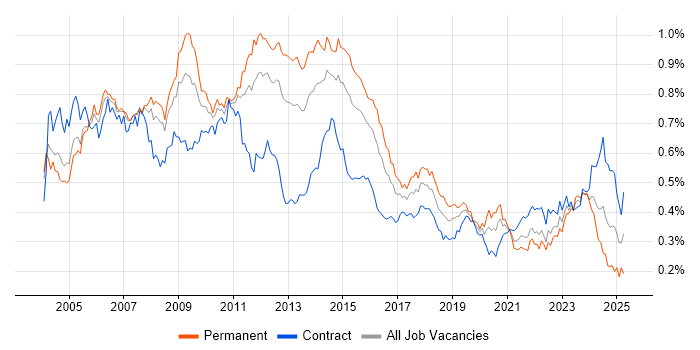
Job vacancy trend for Replication in London

Replication
Salary Trend in London

3-month moving average salary quoted in jobs citing Replication in London.

Salary trend for Replication in London

Replication
Salary Histogram in London

Salary distribution for jobs citing Replication in London over the 6 months to 10 May 2024.

Salary histogram for Replication in London

Replication
Job Locations in London

The table below looks at the demand and provides a guide to the median salaries quoted in IT jobs citing Replication within the London region over the 6 months to 10 May 2024. The 'Rank Change' column provides an indication of the change in demand within each location based on the same 6 month period last year.

Location Rank Change
on Same Period
Last Year
Matching
Permanent
IT Job Ads
Median Salary
Past 6 Months
Median Salary
% Change
on Same Period
Last Year
Live
Jobs
Central London +23 9 £67,500 +3.85% 1
West London - 4 £55,001 -
Replication
England

Replication
Co-occurring Skills and Capabilities in London by Category

The follow tables expand on the table above by listing co-occurrences grouped by category. The same employment type, locality and period is covered with up to 20 co-occurrences shown in each of the following categories:

Application Platforms
1 21 (20.59%) Microsoft Exchange
2 20 (19.61%) SharePoint
3 9 (8.82%) IIS
4 5 (4.90%) WordPress
5 4 (3.92%) Oracle Workflow
6 2 (1.96%) Apache
6 2 (1.96%) nginx
7 1 (0.98%) Blackberry Enterprise Server
7 1 (0.98%) Skype for Business
Applications
1 17 (16.67%) Microsoft Office
2 1 (0.98%) Windchill
Business Applications
1 4 (3.92%) BASE24
1 4 (3.92%) Oracle 11i
1 4 (3.92%) Oracle Applications
1 4 (3.92%) Oracle EBS R12
1 4 (3.92%) Oracle Payroll
2 1 (0.98%) FLEXCUBE
2 1 (0.98%) Misys Opics
2 1 (0.98%) SAP MDG
2 1 (0.98%) SAP MDG-BP
2 1 (0.98%) SAP MDG-F
2 1 (0.98%) SAP S/4HANA
2 1 (0.98%) Unit4 Business World
Cloud Services
1 38 (37.25%) Azure
2 25 (24.51%) Microsoft 365
3 16 (15.69%) AWS
4 7 (6.86%) Entra ID
5 5 (4.90%) OneDrive
6 4 (3.92%) GitHub
6 4 (3.92%) OCI
7 3 (2.94%) Azure Data Factory
7 3 (2.94%) IaaS
8 2 (1.96%) AWS CloudFormation
8 2 (1.96%) Azure ExpressRoute
8 2 (1.96%) Azure Functions
8 2 (1.96%) Azure Monitor
8 2 (1.96%) Azure Storage
8 2 (1.96%) Azure Synapse Analytics
8 2 (1.96%) Google Docs
8 2 (1.96%) Nutanix
8 2 (1.96%) Serverless
8 2 (1.96%) Snowflake
8 2 (1.96%) Virtual Private Cloud
Communications & Networking
1 35 (34.31%) Firewall
2 26 (25.49%) DNS
3 22 (21.57%) SAN
4 19 (18.63%) DHCP
5 18 (17.65%) TCP/IP
5 18 (17.65%) VPN
6 12 (11.76%) VLAN
7 7 (6.86%) Fibre Channel
7 7 (6.86%) Internet
8 6 (5.88%) iSCSI
9 5 (4.90%) NAS
9 5 (4.90%) Wireless
10 4 (3.92%) Wi-Fi
11 3 (2.94%) Network Security
12 2 (1.96%) DKIM
12 2 (1.96%) DMARC
12 2 (1.96%) NetScaler
12 2 (1.96%) SMTP
12 2 (1.96%) SSL
13 1 (0.98%) Cisco ISE
Database & Business Intelligence
1 29 (28.43%) SQL Server
2 12 (11.76%) SQL Server Reporting Services
3 10 (9.80%) MySQL
4 7 (6.86%) Data Warehouse
4 7 (6.86%) PostgreSQL
4 7 (6.86%) SQL Server Integration Services
5 6 (5.88%) InfluxDB
6 5 (4.90%) MongoDB
6 5 (4.90%) Relational Database
7 4 (3.92%) Amazon RDS
7 4 (3.92%) Data Lake
7 4 (3.92%) NonStop SQL
7 4 (3.92%) NoSQL
7 4 (3.92%) SQL Server Analysis Services
8 3 (2.94%) Oracle Database
9 2 (1.96%) Dremio
9 2 (1.96%) MariaDB
9 2 (1.96%) Microsoft Analysis Services
9 2 (1.96%) Qlik Sense
9 2 (1.96%) QlikView
Development Applications
1 16 (15.69%) Git
2 12 (11.76%) Jenkins
2 12 (11.76%) TeamCity
3 10 (9.80%) JIRA
4 4 (3.92%) Toad
5 2 (1.96%) git-flow
5 2 (1.96%) Subversion
General
1 36 (35.29%) Finance
2 21 (20.59%) Social Skills
3 12 (11.76%) Billing
4 10 (9.80%) Legal
5 8 (7.84%) Banking
6 4 (3.92%) Analytical Skills
6 4 (3.92%) Financial Institution
7 2 (1.96%) Games
7 2 (1.96%) Public Sector
7 2 (1.96%) Retail
8 1 (0.98%) Documentation Skills
8 1 (0.98%) Inclusion and Diversity
Job Titles
1 16 (15.69%) Analyst
2 15 (14.71%) Administrator
3 14 (13.73%) Support Analyst
4 13 (12.75%) Architect
4 13 (12.75%) DBA
4 13 (12.75%) IT Support
5 12 (11.76%) Infrastructure Architect
6 11 (10.78%) Systems Engineer
7 8 (7.84%) Infrastructure Engineer
7 8 (7.84%) Platform Engineer
8 7 (6.86%) Linux Engineer
9 6 (5.88%) Technology Support Analyst
10 5 (4.90%) Kubernetes Engineer
10 5 (4.90%) Network Engineer
10 5 (4.90%) Network Infrastructure Engineer
10 5 (4.90%) SQL DBA
11 4 (3.92%) IT Support Analyst
11 4 (3.92%) Junior
11 4 (3.92%) Junior IT Support
11 4 (3.92%) Systems Administrator
Libraries, Frameworks & Software Standards
1 7 (6.86%) LAMP
2 4 (3.92%) Kafka
2 4 (3.92%) Middleware
2 4 (3.92%) Oracle GoldenGate
2 4 (3.92%) XML
3 3 (2.94%) .NET
4 2 (1.96%) ARM Templates
4 2 (1.96%) LEMP Stack
5 1 (0.98%) EDI
5 1 (0.98%) JSON
5 1 (0.98%) REST
5 1 (0.98%) SAP ALE
5 1 (0.98%) SOAP
Miscellaneous
1 26 (25.49%) Data Centre
2 22 (21.57%) Clustering
3 13 (12.75%) Public Cloud
4 7 (6.86%) Linux Command Line
5 6 (5.88%) AS400
6 4 (3.92%) Cyber Threat
6 4 (3.92%) Cyberattack
6 4 (3.92%) Data Fabric
6 4 (3.92%) Onboarding
7 3 (2.94%) PKI
8 2 (1.96%) Data Protection Act
8 2 (1.96%) Hybrid Cloud
8 2 (1.96%) Private Cloud
8 2 (1.96%) Virtual Team
9 1 (0.98%) Blackberry
9 1 (0.98%) Driving Licence
Operating Systems
1 61 (59.80%) Windows
2 42 (41.18%) Linux
3 39 (38.24%) Windows Server
4 24 (23.53%) Ubuntu
5 21 (20.59%) Windows 10
6 15 (14.71%) Windows Server 2008
7 14 (13.73%) Solaris
8 12 (11.76%) Oracle Linux
8 12 (11.76%) SUSE
8 12 (11.76%) Windows Server 2012
9 11 (10.78%) Red Hat Enterprise Linux
9 11 (10.78%) Windows Server 2019
10 7 (6.86%) Unix
10 7 (6.86%) Windows Server 2016
11 6 (5.88%) VMS
12 4 (3.92%) CentOS
12 4 (3.92%) zOS
13 3 (2.94%) Debian
14 2 (1.96%) AIX
15 1 (0.98%) Mac OS
Processes & Methodologies
1 36 (35.29%) Disaster Recovery
1 36 (35.29%) ITIL
2 30 (29.41%) High Availability
3 29 (28.43%) Performance Tuning
4 28 (27.45%) Cybersecurity
5 24 (23.53%) Continuous Improvement
5 24 (23.53%) ITSM
6 15 (14.71%) Infrastructure as Code
7 14 (13.73%) Batch Scripting
7 14 (13.73%) Cryptography
7 14 (13.73%) Data Loss Prevention
7 14 (13.73%) Kalman Filter
8 13 (12.75%) Mentoring
8 13 (12.75%) Presales
8 13 (12.75%) Task Automation
9 12 (11.76%) Deployment Automation
9 12 (11.76%) Network Monitoring
9 12 (11.76%) Project Delivery
9 12 (11.76%) Security Hardening
9 12 (11.76%) Virtual Infrastructure
Programming Languages
1 48 (47.06%) PowerShell
2 32 (31.37%) SQL
3 16 (15.69%) Python
4 15 (14.71%) Bash
4 15 (14.71%) C#
5 10 (9.80%) RPG
6 5 (4.90%) T-SQL
7 4 (3.92%) JavaScript
8 2 (1.96%) Perl
8 2 (1.96%) PHP
8 2 (1.96%) Ruby
8 2 (1.96%) Scala
9 1 (0.98%) PL/SQL
Qualifications
1 32 (31.37%) Microsoft Certification
2 28 (27.45%) MCSA
3 24 (23.53%) Degree
4 17 (16.67%) MCSE
5 14 (13.73%) CREST Certified
5 14 (13.73%) VMware Certified Professional (VCP)
6 3 (2.94%) CCNA
6 3 (2.94%) Cisco Certification
7 2 (1.96%) Computer Science Degree
8 1 (0.98%) Azure Certification
8 1 (0.98%) DBS Check
8 1 (0.98%) IBM Certification
8 1 (0.98%) ITIL Certification
8 1 (0.98%) LPIC
8 1 (0.98%) MCP
8 1 (0.98%) Oracle Certification
Quality Assurance & Compliance
1 4 (3.92%) Cyber Essentials
2 2 (1.96%) HIPAA
2 2 (1.96%) PCI DSS
2 2 (1.96%) SLA
3 1 (0.98%) GDPR
3 1 (0.98%) ISO 22301
3 1 (0.98%) NIST
3 1 (0.98%) NIST 800
3 1 (0.98%) QA
System Software
1 44 (43.14%) Active Directory
2 43 (42.16%) VMware Infrastructure
3 21 (20.59%) vSphere
4 14 (13.73%) Docker
4 14 (13.73%) VMware ESXi
5 12 (11.76%) Firmware
5 12 (11.76%) vCloud
6 4 (3.92%) Virtual Servers
7 3 (2.94%) Virtual Machines
8 2 (1.96%) Ceph
8 2 (1.96%) Microsoft Virtual Server
9 1 (0.98%) Hyper-V
9 1 (0.98%) Oracle RAC
9 1 (0.98%) Veritas Cluster Server
Systems Management
1 16 (15.69%) Ansible
1 16 (15.69%) Terraform
2 15 (14.71%) SCOM
3 14 (13.73%) Kubernetes
4 8 (7.84%) Grafana
5 7 (6.86%) Microsoft Intune
6 6 (5.88%) Prometheus
6 6 (5.88%) SCCM
7 4 (3.92%) Failover Clustering
7 4 (3.92%) Istio
7 4 (3.92%) PaperCut
8 3 (2.94%) WSUS
9 2 (1.96%) Data Guard
9 2 (1.96%) Foglight
9 2 (1.96%) HP SIM
9 2 (1.96%) Kibana
9 2 (1.96%) SCOrch
9 2 (1.96%) Single Sign-On
9 2 (1.96%) vRealize Orchestrator
9 2 (1.96%) ZABBIX
Vendors
1 49 (48.04%) VMware
2 37 (36.27%) Microsoft
3 34 (33.33%) Veeam
4 28 (27.45%) Oracle
5 21 (20.59%) Cisco
6 19 (18.63%) HP
7 17 (16.67%) IBM
8 14 (13.73%) Bloomberg
8 14 (13.73%) FactSet
8 14 (13.73%) MobileIron
8 14 (13.73%) Refinitiv
9 12 (11.76%) Fujitsu
9 12 (11.76%) NetApp
9 12 (11.76%) Serena
10 11 (10.78%) Dell
11 7 (6.86%) Red Hat
12 5 (4.90%) Aruba
12 5 (4.90%) Google
12 5 (4.90%) ProCurve
12 5 (4.90%) Synology