Distributed Systems Jobs in London

Distributed Systems
England > London

The table below looks at the prevalence of the term Distributed Systems in permanent job vacancies in London. Included is a benchmarking guide to the salaries offered in vacancies that cited Distributed Systems over the 6 months leading up to 17 June 2025, comparing them to the same period in the previous two years.

6 months to
17 Jun 2025
Same period 2024 Same period 2023
Rank 199 291 230
Rank change year-on-year +92 -61 -85
Permanent jobs citing Distributed Systems 227 236 489
As % of all permanent jobs advertised in London 1.77% 0.95% 1.58%
As % of the Miscellaneous category 3.89% 2.39% 3.47%
Number of salaries quoted 110 155 284
10th Percentile £56,250 £72,500 £62,000
25th Percentile £85,000 £81,250 £75,000
Median annual salary (50th Percentile) £108,750 £100,000 £92,500
Median % change year-on-year +8.75% +8.11% +2.78%
75th Percentile £115,000 £135,000 £116,250
90th Percentile £145,250 £155,000 £133,500
England median annual salary £90,000 £82,500 £87,500
% change year-on-year +9.09% -5.71% +2.94%

All Generic Skills
London

Distributed Systems falls under the General and Transferable Skills category. For comparison with the information above, the following table provides summary statistics for all permanent job vacancies requiring generic IT skills in London.

Permanent vacancies with a requirement for generic IT skills 5,831 9,892 14,103
As % of all permanent jobs advertised in London 45.37% 39.90% 45.66%
Number of salaries quoted 3,059 6,873 9,814
10th Percentile £41,250 £37,500 £43,750
25th Percentile £56,250 £51,250 £56,250
Median annual salary (50th Percentile) £80,000 £75,000 £76,000
Median % change year-on-year +6.67% -1.32% +1.33%
75th Percentile £110,000 £100,000 £100,000
90th Percentile £136,250 £130,000 £125,000
England median annual salary £60,000 £55,000 £65,000
% change year-on-year +9.09% -15.38% +4.00%

Distributed Systems
Job Vacancy Trend in London

Job postings citing Distributed Systems as a proportion of all IT jobs advertised in London.
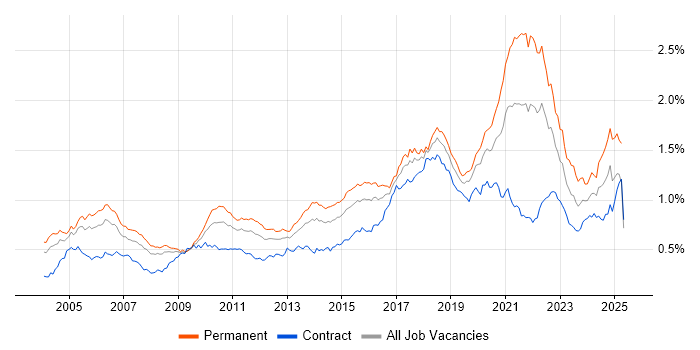
Job vacancy trend for Distributed Systems in London

Distributed Systems
Salary Trend in London

3-month moving average salary quoted in jobs citing Distributed Systems in London.

Salary trend for Distributed Systems in London

Distributed Systems
Salary Histogram in London

Salary distribution for jobs citing Distributed Systems in London over the 6 months to 17 June 2025.

Salary histogram for Distributed Systems in London

Distributed Systems
Job Locations in London

The table below looks at the demand and provides a guide to the median salaries quoted in IT jobs citing Distributed Systems within the London region over the 6 months to 17 June 2025. The 'Rank Change' column provides an indication of the change in demand within each location based on the same 6 month period last year.

Location Rank Change
on Same Period
Last Year
Matching
Permanent
IT Job Ads
Median Salary
Past 6 Months
Median Salary
% Change
on Same Period
Last Year
Live
Jobs
Central London +50 38 £62,500 -26.47% 203
South London +5 34 - - 1
West London +24 1 £65,000 - 31
Distributed Systems
England

Distributed Systems
Co-occurring Skills and Capabilities in London by Category

The follow tables expand on the table above by listing co-occurrences grouped by category. The same employment type, locality and period is covered with up to 20 co-occurrences shown in each of the following categories:

Application Platforms
1 28 (12.33%) Apache Spark
2 14 (6.17%) JBoss
2 14 (6.17%) Red Hat Fuse
3 6 (2.64%) Apache Airflow
4 5 (2.20%) OpenStack
5 2 (0.88%) Confluence
6 1 (0.44%) Apache Solr
6 1 (0.44%) Ethereum
6 1 (0.44%) nginx
6 1 (0.44%) SAS
Applications
1 1 (0.44%) Microsoft Excel
1 1 (0.44%) Microsoft PowerPoint
Cloud Services
1 99 (43.61%) AWS
2 38 (16.74%) Amazon EKS
3 36 (15.86%) Amazon ECS
3 36 (15.86%) Serverless
4 35 (15.42%) GCP
5 33 (14.54%) Azure
6 16 (7.05%) Amazon EC2
7 11 (4.85%) Azure DevOps
8 7 (3.08%) Azure Monitor
9 5 (2.20%) Amazon SQS
10 4 (1.76%) Amazon EMR
10 4 (1.76%) Amazon S3
10 4 (1.76%) AWS CloudFormation
10 4 (1.76%) SaaS
11 3 (1.32%) Amazon ECR
11 3 (1.32%) Amazon ElastiCache
11 3 (1.32%) Amazon OpenSearch
11 3 (1.32%) Cloud Computing
11 3 (1.32%) dbt
11 3 (1.32%) Sentry
Communications & Networking
1 14 (6.17%) HTTP
2 3 (1.32%) TCP/IP
3 1 (0.44%) Multicast
3 1 (0.44%) NAS
3 1 (0.44%) SAN
3 1 (0.44%) WAN
Database & Business Intelligence
1 42 (18.50%) Relational Database
2 41 (18.06%) PostgreSQL
3 19 (8.37%) Big Data
4 17 (7.49%) NoSQL
5 15 (6.61%) RDBMS
6 8 (3.52%) Apache Iceberg
6 8 (3.52%) MongoDB
7 7 (3.08%) Redis
8 5 (2.20%) Flink
8 5 (2.20%) SQL Server
9 4 (1.76%) Amazon RDS
9 4 (1.76%) Electronic Patient Records
9 4 (1.76%) Spark SQL
10 3 (1.32%) Elasticsearch
10 3 (1.32%) MySQL
10 3 (1.32%) Oracle Database
11 2 (0.88%) Azure SQL Database
11 2 (0.88%) Metadata
12 1 (0.44%) BigQuery
12 1 (0.44%) Data Lake
Development Applications
1 45 (19.82%) Jenkins
2 36 (15.86%) Git
3 35 (15.42%) JUnit
4 19 (8.37%) Mockito
5 16 (7.05%) JMeter
6 9 (3.96%) Gradle
7 8 (3.52%) JIRA
8 5 (2.20%) Maven
9 4 (1.76%) GitLab
9 4 (1.76%) Postman
9 4 (1.76%) SonarQube
9 4 (1.76%) Terragrunt
10 3 (1.32%) Atlassian Bamboo
10 3 (1.32%) REST Assured
10 3 (1.32%) SoapUI
10 3 (1.32%) Subversion
10 3 (1.32%) Xcode
10 3 (1.32%) XCTest
11 2 (0.88%) TeamCity
12 1 (0.44%) Selenium
General
1 106 (46.70%) Finance
2 77 (33.92%) Social Skills
3 74 (32.60%) Inclusion and Diversity
4 73 (32.16%) Banking
5 56 (24.67%) Law
6 35 (15.42%) Public Sector
7 17 (7.49%) Games
8 16 (7.05%) Advertising
9 15 (6.61%) Analytical Skills
9 15 (6.61%) Front Office
9 15 (6.61%) Retail
10 14 (6.17%) Investment Banking
11 13 (5.73%) Marketing
12 11 (4.85%) Legal
13 8 (3.52%) Financial Institution
14 5 (2.20%) Telecoms
15 4 (1.76%) Influencing Skills
15 4 (1.76%) Publishing
16 3 (1.32%) Presentation Skills
17 2 (0.88%) Organisational Skills
Job Titles
1 109 (48.02%) Software Engineer
2 67 (29.52%) Senior
3 53 (23.35%) Developer
3 53 (23.35%) Lead
4 48 (21.15%) Lead Software Engineer
5 47 (20.70%) Senior Software Engineer
6 44 (19.38%) Java Developer
7 40 (17.62%) Cloud Engineer
8 35 (15.42%) Cloud Software Engineer
9 31 (13.66%) Cloud Native Engineer
10 21 (9.25%) Java Engineer
11 20 (8.81%) Java Software Engineer
11 20 (8.81%) Lead Cloud Engineer
12 14 (6.17%) Python Engineer
12 14 (6.17%) Python Software Engineer
12 14 (6.17%) Senior Cloud Engineer
13 13 (5.73%) Principal Engineer
14 12 (5.29%) AWS Engineer
14 12 (5.29%) AWS Software Engineer
15 10 (4.41%) Full-Stack Developer
Libraries, Frameworks & Software Standards
1 57 (25.11%) Spring
2 50 (22.03%) Kafka
3 47 (20.70%) Spring Boot
4 45 (19.82%) Web Services
5 42 (18.50%) REST
6 41 (18.06%) RESTful
7 29 (12.78%) Apache Camel
8 23 (10.13%) Hibernate
9 19 (8.37%) HTML
10 18 (7.93%) SOAP
11 17 (7.49%) J2EE
11 17 (7.49%) jQuery
12 16 (7.05%) ActiveMQ
13 15 (6.61%) WireMock
14 14 (6.17%) React
15 7 (3.08%) AngularJS
15 7 (3.08%) ARM Templates
15 7 (3.08%) JSON
15 7 (3.08%) RabbitMQ
15 7 (3.08%) XML
Miscellaneous
1 85 (37.44%) Cloud Native
2 38 (16.74%) Algorithms
3 31 (13.66%) Legacy Code
4 22 (9.69%) Data Structures
5 21 (9.25%) Foreign Exchange (FX)
6 17 (7.49%) Public Cloud
7 14 (6.17%) Derivative
7 14 (6.17%) Virtual Team
8 11 (4.85%) Fixed Income
9 9 (3.96%) Equities
9 9 (3.96%) Greenfield Project
9 9 (3.96%) Mobile Banking
10 8 (3.52%) Equity Derivative
10 8 (3.52%) Hedge funds
10 8 (3.52%) Management Information System
10 8 (3.52%) Onboarding
11 5 (2.20%) Product Ownership
11 5 (2.20%) Team-Oriented Environment
12 4 (1.76%) Enterprise Software
13 3 (1.32%) Mobile App
Operating Systems
1 54 (23.79%) Linux
2 6 (2.64%) Unix
3 4 (1.76%) Windows
4 3 (1.32%) Red Hat Enterprise Linux
4 3 (1.32%) Windows Server
5 1 (0.44%) zOS
Processes & Methodologies
1 136 (59.91%) Software Engineering
2 106 (46.70%) Agile
3 100 (44.05%) Microservices
4 94 (41.41%) CI/CD
5 61 (26.87%) TDD
6 56 (24.67%) SDLC
7 52 (22.91%) DevOps
8 41 (18.06%) Machine Learning
8 41 (18.06%) Problem-Solving
9 40 (17.62%) BDD
10 36 (15.86%) Computer Science
11 31 (13.66%) Artificial Intelligence
12 30 (13.22%) Containerisation
13 28 (12.33%) Fintech
13 28 (12.33%) Scrum
14 24 (10.57%) Kanban
15 23 (10.13%) Continuous Improvement
15 23 (10.13%) Operational Stability
15 23 (10.13%) Test Automation
16 22 (9.69%) Full-Stack Development
Programming Languages
1 116 (51.10%) Java
2 80 (35.24%) Python
3 47 (20.70%) C++
4 39 (17.18%) Go
4 39 (17.18%) SQL
5 37 (16.30%) Rust
6 33 (14.54%) C
7 27 (11.89%) Scala
8 26 (11.45%) JavaScript
9 20 (8.81%) Kotlin
10 18 (7.93%) Shell Script
11 9 (3.96%) PowerShell
12 8 (3.52%) C#
12 8 (3.52%) TypeScript
13 7 (3.08%) Groovy
14 3 (1.32%) Bash
15 2 (0.88%) PHP
16 1 (0.44%) Bicep
16 1 (0.44%) JCL
16 1 (0.44%) T-SQL
Qualifications
1 34 (14.98%) Degree
2 28 (12.33%) Security Cleared
3 27 (11.89%) SC Cleared
4 8 (3.52%) Computer Science Degree
5 7 (3.08%) Azure Certification
5 7 (3.08%) Master's Degree
5 7 (3.08%) PhD
6 3 (1.32%) AWS Certification
6 3 (1.32%) AWS Certified Solutions Architect
7 2 (0.88%) DV Cleared
7 2 (0.88%) TOGAF Certification
Quality Assurance & Compliance
1 14 (6.17%) SLA
2 12 (5.29%) QA
3 9 (3.96%) GDPR
4 7 (3.08%) HIPAA
4 7 (3.08%) SOC 2
5 3 (1.32%) Data Quality
6 2 (0.88%) ISO/IEC 27001
6 2 (0.88%) NIST
System Software
1 81 (35.68%) Docker
2 7 (3.08%) Virtual Machines
3 3 (1.32%) VMware ESXi
3 3 (1.32%) vSphere
4 1 (0.44%) Job Entry Subsystem
4 1 (0.44%) Postfix
4 1 (0.44%) Time Sharing Option
Systems Management
1 125 (55.07%) Kubernetes
2 28 (12.33%) Terraform
3 17 (7.49%) Ansible
4 15 (6.61%) Kibana
5 4 (1.76%) Grafana
6 3 (1.32%) Argo
6 3 (1.32%) AWS Copilot
7 1 (0.44%) Kubeflow
7 1 (0.44%) Kustomize
7 1 (0.44%) Prometheus
Vendors
1 23 (10.13%) Google
2 20 (8.81%) Splunk
3 18 (7.93%) Dynatrace
3 18 (7.93%) Microsoft
4 14 (6.17%) Apple
5 3 (1.32%) CA Agile Central
5 3 (1.32%) Foundry
5 3 (1.32%) NetApp
5 3 (1.32%) Oracle
5 3 (1.32%) Palantir
6 2 (0.88%) ESRI
6 2 (0.88%) SAP
7 1 (0.44%) Bloomberg
7 1 (0.44%) Databricks
7 1 (0.44%) IBM
7 1 (0.44%) Reuters
7 1 (0.44%) Solace
7 1 (0.44%) Syncsort