Load Balancing Jobs in the UK excluding London

Load Balancing
UK > UK excluding London

The following table provides summary statistics for permanent job vacancies advertised in the UK excluding London with a requirement for Load Balancing skills. Included is a benchmarking guide to the salaries offered in vacancies that have cited Load Balancing over the 6 months to 26 April 2024 with a comparison to the same period in the previous 2 years.

6 months to
26 Apr 2024
Same period 2023 Same period 2022
Rank 540 508 491
Rank change year-on-year -32 -17 -51
Permanent jobs citing Load Balancing 218 256 381
As % of all permanent jobs advertised in the UK excluding London 0.31% 0.41% 0.54%
As % of the Processes & Methodologies category 0.37% 0.43% 0.57%
Number of salaries quoted 159 141 277
10th Percentile £41,250 £36,250 £32,650
25th Percentile £46,250 £43,546 £42,500
Median annual salary (50th Percentile) £55,000 £55,000 £55,000
Median % change year-on-year - - +4.76%
75th Percentile £64,375 £65,000 £67,500
90th Percentile £73,750 £83,750 £73,750
UK median annual salary £60,000 £58,000 £62,500
% change year-on-year +3.45% -7.20% +11.61%

All Process and Methodology Skills
UK excluding London

Load Balancing is in the Processes and Methodologies category. The following table is for comparison with the above and provides summary statistics for all permanent job vacancies advertised in the UK excluding London with a requirement for process or methodology skills.

Permanent vacancies with a requirement for process or methodology skills 59,230 59,150 66,407
As % of all permanent jobs advertised in the UK excluding London 84.47% 95.64% 94.08%
Number of salaries quoted 41,096 30,337 41,441
10th Percentile £27,234 £30,500 £30,000
25th Percentile £36,250 £40,000 £38,750
Median annual salary (50th Percentile) £50,000 £55,000 £52,500
Median % change year-on-year -9.09% +4.76% +9.38%
75th Percentile £65,000 £70,000 £67,500
90th Percentile £77,500 £82,500 £80,000
UK median annual salary £55,000 £62,000 £60,000
% change year-on-year -11.29% +3.33% +9.09%

Load Balancing
Job Vacancy Trend in the UK excluding London

Job postings citing Load Balancing as a proportion of all IT jobs advertised in the UK excluding London.
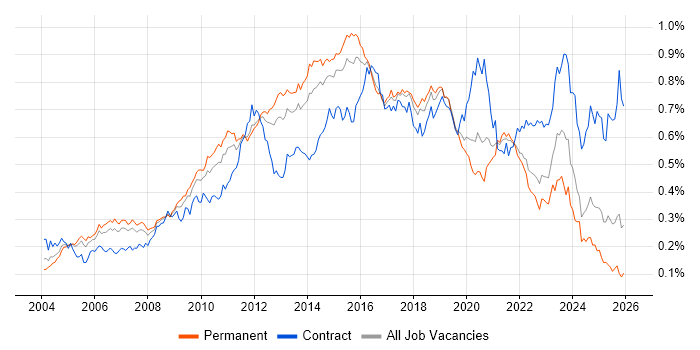
Job vacancy trend for Load Balancing in the UK excluding London

Load Balancing
Salary Trend in the UK excluding London

3-month moving average salary quoted in jobs citing Load Balancing in the UK excluding London.

Salary trend for Load Balancing in the UK excluding London

Load Balancing
Salary Histogram in the UK excluding London

Salary distribution for jobs citing Load Balancing in the UK excluding London over the 6 months to 26 April 2024.

Salary histogram for Load Balancing in the UK excluding London

Load Balancing
Job Locations in the UK excluding London

The table below looks at the demand and provides a guide to the median salaries quoted in IT jobs citing Load Balancing within the UK excluding London region over the 6 months to 26 April 2024. The 'Rank Change' column provides an indication of the change in demand within each location based on the same 6 month period last year.

Location Rank Change
on Same Period
Last Year
Matching
Permanent
IT Job Ads
Median Salary
Past 6 Months
Median Salary
% Change
on Same Period
Last Year
Live
Jobs
Midlands +20 69 £52,500 -12.50% 17
West Midlands +39 57 £52,500 -17.97% 11
South East +17 37 £55,000 - 9
North of England -2 35 £60,000 +26.98% 6
South West -11 28 £45,000 +5.88% 7
Scotland -55 20 £52,500 -4.55% 1
Yorkshire +91 17 £61,250 +44.12% 2
East of England +10 16 £52,500 -12.50% 6
North West -24 16 £60,000 +20.00% 4
East Midlands -16 12 £50,000 -13.04% 6
Wales +14 9 £65,000 -
Northern Ireland +20 4 - -
North East -11 2 £85,000 +126.67%
Load Balancing
UK

Load Balancing
Co-occurring Skills and Capabilities in the UK excluding London by Category

The follow tables expand on the table above by listing co-occurrences grouped by category. The same employment type, locality and period is covered with up to 20 co-occurrences shown in each of the following categories:

Application Platforms
1 42 (19.27%) WebLogic
2 34 (15.60%) IIS
3 27 (12.39%) SharePoint
4 8 (3.67%) Microsoft Exchange
5 3 (1.38%) Apache
6 2 (0.92%) Oracle Application Server
7 1 (0.46%) nginx
7 1 (0.46%) OpenStack
7 1 (0.46%) WordPress
Applications
1 3 (1.38%) Microsoft Office
Business Applications
1 40 (18.35%) Sparx Enterprise Architect
Cloud Services
1 154 (70.64%) Azure
2 88 (40.37%) AWS
3 40 (18.35%) Amazon EKS
3 40 (18.35%) Amazon SQS
4 26 (11.93%) Microsoft 365
5 21 (9.63%) SaaS
6 17 (7.80%) GCP
7 15 (6.88%) OneDrive
8 13 (5.96%) IaaS
9 12 (5.50%) PaaS
10 10 (4.59%) Amazon S3
11 8 (3.67%) Azure DevOps
12 7 (3.21%) AWS Lambda
12 7 (3.21%) Serverless
13 6 (2.75%) GitHub
14 5 (2.29%) Amazon EC2
14 5 (2.29%) Dynamics 365
14 5 (2.29%) GitHub Actions
15 4 (1.83%) Azure Functions
15 4 (1.83%) Azure Monitor
Communications & Networking
1 69 (31.65%) Firewall
2 68 (31.19%) WAN
3 67 (30.73%) DNS
4 57 (26.15%) BGP
5 52 (23.85%) TCP/IP
6 41 (18.81%) VPN
7 40 (18.35%) SSL
8 29 (13.30%) LAN
9 23 (10.55%) SAN
10 20 (9.17%) BIG-IP
11 18 (8.26%) DHCP
12 16 (7.34%) MPLS
13 13 (5.96%) Wireless
14 12 (5.50%) SD-WAN
15 10 (4.59%) OSPF
16 9 (4.13%) Cisco ASA
16 9 (4.13%) F5 BIG-IP LTM
16 9 (4.13%) Network Security
17 8 (3.67%) IPsec
18 7 (3.21%) Internet
Database & Business Intelligence
1 56 (25.69%) SQL Server
2 48 (22.02%) Amazon RDS
3 45 (20.64%) RDBMS
3 45 (20.64%) Relational Database
4 41 (18.81%) Oracle Database
5 17 (7.80%) MySQL
6 11 (5.05%) PostgreSQL
7 7 (3.21%) Redis
8 6 (2.75%) InfluxDB
9 5 (2.29%) BigQuery
9 5 (2.29%) Elasticsearch
9 5 (2.29%) MongoDB
9 5 (2.29%) Neo4j
9 5 (2.29%) TimescaleDB
10 2 (0.92%) Apache Cassandra
10 2 (0.92%) Data Warehouse
10 2 (0.92%) DynamoDB
11 1 (0.46%) MariaDB
11 1 (0.46%) NoSQL
11 1 (0.46%) Power BI
Development Applications
1 5 (2.29%) GDB
2 4 (1.83%) Sonatype Nexus
3 3 (1.38%) Git
3 3 (1.38%) JIRA
4 2 (0.92%) MSBuild
5 1 (0.46%) GitLab
5 1 (0.46%) Jenkins
General
1 81 (37.16%) Social Skills
2 19 (8.72%) Finance
3 17 (7.80%) Law
4 15 (6.88%) Organisational Skills
5 13 (5.96%) Retail
6 7 (3.21%) Advertising
7 6 (2.75%) Analytical Skills
8 4 (1.83%) Telecoms
9 3 (1.38%) Documentation Skills
9 3 (1.38%) Inclusion and Diversity
9 3 (1.38%) Influencing Skills
10 2 (0.92%) Military
10 2 (0.92%) Presentation Skills
10 2 (0.92%) Public Sector
11 1 (0.46%) Games
11 1 (0.46%) Legal
Job Titles
1 61 (27.98%) Senior
2 52 (23.85%) Architect
3 45 (20.64%) Lead
4 40 (18.35%) Lead Architect
4 40 (18.35%) Lead Solutions Architect
4 40 (18.35%) Solutions Architect
5 34 (15.60%) Network Engineer
6 31 (14.22%) Administrator
7 25 (11.47%) Systems Engineer
8 22 (10.09%) Senior Systems Engineer
9 21 (9.63%) Infrastructure Engineer
10 15 (6.88%) Systems Administrator
11 14 (6.42%) Senior Network Engineer
12 12 (5.50%) SharePoint Administrator
13 11 (5.05%) Developer
13 11 (5.05%) Support Engineer
14 10 (4.59%) Linux Administrator
14 10 (4.59%) Linux Systems Administrator
15 9 (4.13%) Network Infrastructure Engineer
16 7 (3.21%) Senior Infrastructure Engineer
Libraries, Frameworks & Software Standards
1 40 (18.35%) RabbitMQ
1 40 (18.35%) Spring Boot
2 27 (12.39%) REST
2 27 (12.39%) WebRTC
3 9 (4.13%) .NET
4 7 (3.21%) .NET Core
5 5 (2.29%) Django
5 5 (2.29%) FastAPI
5 5 (2.29%) Flask
5 5 (2.29%) Kafka
6 4 (1.83%) ASP.NET
7 3 (1.38%) CSS
7 3 (1.38%) CSS3
7 3 (1.38%) HTML
7 3 (1.38%) HTML5
7 3 (1.38%) Laravel
8 2 (0.92%) AngularJS
8 2 (0.92%) AWS CDK
8 2 (0.92%) Node.js
8 2 (0.92%) Vue
Miscellaneous
1 53 (24.31%) Public Cloud
2 41 (18.81%) Enterprise Software
3 32 (14.68%) Clustering
4 23 (10.55%) Data Centre
5 12 (5.50%) PKI
6 9 (4.13%) Product Ownership
7 7 (3.21%) IoT
8 6 (2.75%) Cloud Native
9 5 (2.29%) Greenfield Project
9 5 (2.29%) Hybrid Cloud
10 3 (1.38%) Virtual Team
11 2 (0.92%) Data Structures
11 2 (0.92%) Management Information System
11 2 (0.92%) Self-Motivation
12 1 (0.46%) Legacy Systems
12 1 (0.46%) Life Science
12 1 (0.46%) Linux Command Line
12 1 (0.46%) NHS
12 1 (0.46%) Replication
12 1 (0.46%) Security Posture
Operating Systems
1 88 (40.37%) Linux
2 55 (25.23%) Red Hat Enterprise Linux
3 53 (24.31%) Windows
4 34 (15.60%) Windows Server
5 11 (5.05%) Windows 10
6 10 (4.59%) CentOS
6 10 (4.59%) Ubuntu
6 10 (4.59%) Windows 7
7 7 (3.21%) Unix
7 7 (3.21%) Windows Server 2019
8 6 (2.75%) Windows Server 2003
9 5 (2.29%) Debian
9 5 (2.29%) Solaris
10 4 (1.83%) Android
10 4 (1.83%) Apple iOS
11 1 (0.46%) VMS
11 1 (0.46%) Windows Server 2012
11 1 (0.46%) Windows Server 2016
Processes & Methodologies
1 64 (29.36%) Problem-Solving
2 61 (27.98%) Agile
3 54 (24.77%) Migration
4 50 (22.94%) Open Source
5 42 (19.27%) Project Management
5 42 (19.27%) Scrum
6 41 (18.81%) Re-Platforming
7 40 (18.35%) Actionable Insight
7 40 (18.35%) ArchiMate
7 40 (18.35%) Cloud Operations
7 40 (18.35%) Collaborative Working
7 40 (18.35%) Data Migration
7 40 (18.35%) Kanban
7 40 (18.35%) SDLC
7 40 (18.35%) Systems Engineering
7 40 (18.35%) TOGAF
8 39 (17.89%) High Availability
9 24 (11.01%) DevOps
9 24 (11.01%) Infrastructure Engineering
10 22 (10.09%) CI/CD
Programming Languages
1 46 (21.10%) SQL
2 30 (13.76%) PowerShell
3 17 (7.80%) Python
4 16 (7.34%) T-SQL
5 13 (5.96%) C#
6 12 (5.50%) Bash
6 12 (5.50%) C
7 10 (4.59%) JavaScript
7 10 (4.59%) PHP
8 8 (3.67%) Java
9 6 (2.75%) Shell Script
10 5 (2.29%) Go
11 3 (1.38%) Bicep
11 3 (1.38%) C++
12 2 (0.92%) ActionScript
Qualifications
1 86 (39.45%) Security Cleared
2 73 (33.49%) SC Cleared
3 44 (20.18%) AWS Certification
4 42 (19.27%) AWS Certified Solutions Architect
4 42 (19.27%) Azure Certification
5 26 (11.93%) Cisco Certification
6 25 (11.47%) Degree
7 22 (10.09%) CCNP
8 17 (7.80%) CCNA
8 17 (7.80%) Computer Science Degree
9 10 (4.59%) DV Cleared
10 7 (3.21%) Master's Degree
11 5 (2.29%) RHCE
11 5 (2.29%) RHCSA
12 4 (1.83%) CCIE
12 4 (1.83%) DBS Check
13 3 (1.38%) CCDA
13 3 (1.38%) Microsoft Certification
14 2 (0.92%) CCDP
14 2 (0.92%) PMP
Quality Assurance & Compliance
1 7 (3.21%) ISO 13485
1 7 (3.21%) QA
2 5 (2.29%) ISO/IEC 27001
3 3 (1.38%) SLA
4 2 (0.92%) Accessibility
5 1 (0.46%) Cyber Essentials
5 1 (0.46%) Cyber Essentials PLUS
5 1 (0.46%) ISO 9001
System Software
1 58 (26.61%) VMware Infrastructure
2 33 (15.14%) Active Directory
3 21 (9.63%) vSphere
4 17 (7.80%) VMware NSX
5 14 (6.42%) VMware ESXi
6 12 (5.50%) Docker
7 7 (3.21%) VMware Server
8 4 (1.83%) Virtual Machines
9 3 (1.38%) Hyper-V
10 2 (0.92%) Firmware
10 2 (0.92%) Shibboleth
11 1 (0.46%) Citrix Hypervisor
11 1 (0.46%) Oracle RAC
11 1 (0.46%) Terminal Services
Systems Management
1 26 (11.93%) Terraform
2 18 (8.26%) Kubernetes
3 16 (7.34%) Ansible
4 7 (3.21%) Microsoft Intune
4 7 (3.21%) Puppet
5 6 (2.75%) NetCrunch
5 6 (2.75%) Progress Chef
6 5 (2.29%) Failover Clustering
7 4 (1.83%) EMC NetWorker
7 4 (1.83%) FortiGate
7 4 (1.83%) Istio
7 4 (1.83%) Prometheus
7 4 (1.83%) vCenter Server
8 3 (1.38%) SCOM
8 3 (1.38%) SCOrch
8 3 (1.38%) vMotion
9 2 (0.92%) Nagios
9 2 (0.92%) Single Sign-On
10 1 (0.46%) Data Guard
10 1 (0.46%) Oracle Enterprise Manager
Vendors
1 75 (34.40%) Microsoft
2 70 (32.11%) VMware
3 45 (20.64%) Cisco
4 43 (19.72%) Oracle
5 40 (18.35%) Sparx
6 36 (16.51%) F5
7 33 (15.14%) CheckPoint
8 20 (9.17%) Palo Alto
9 14 (6.42%) Juniper
10 10 (4.59%) Google
10 10 (4.59%) Meraki
10 10 (4.59%) Splunk
11 8 (3.67%) Aruba
12 6 (2.75%) Fortinet
12 6 (2.75%) Ivanti
13 5 (2.29%) Red Hat
14 4 (1.83%) 3PAR
14 4 (1.83%) Commvault
14 4 (1.83%) EMC
14 4 (1.83%) SolarWinds