Collaborative Culture Jobs in the UK excluding London

Culture of Collaboration
UK > UK excluding London

The table below provides summary statistics for permanent job vacancies advertised in the UK excluding London requiring Collaborative Culture skills. It includes a benchmarking guide to the annual salaries offered in vacancies that cited Collaborative Culture over the 6 months leading up to 30 May 2025, comparing them to the same period in the previous two years.

6 months to
30 May 2025
Same period 2024 Same period 2023
Rank 187 291 233
Rank change year-on-year +104 -58 +4
Permanent jobs citing Collaborative Culture 664 669 912
As % of all permanent jobs advertised in the UK excluding London 1.69% 0.90% 1.57%
As % of the Processes & Methodologies category 1.82% 1.09% 1.64%
Number of salaries quoted 337 479 193
10th Percentile £28,500 £31,250 £30,688
25th Percentile £36,750 £42,500 £41,728
Median annual salary (50th Percentile) £52,500 £60,000 £57,500
Median % change year-on-year -12.50% +4.35% +15.00%
75th Percentile £71,250 £73,750 £68,750
90th Percentile £87,500 £95,000 £77,530
UK median annual salary £60,000 £65,000 £65,000
% change year-on-year -7.69% - +8.33%

All Process and Methodology Skills
UK excluding London

Collaborative Culture falls under the Processes and Methodologies category. For comparison with the information above, the following table provides summary statistics for all permanent job vacancies requiring process or methodology skills in the UK excluding London.

Permanent vacancies with a requirement for process or methodology skills 36,483 61,419 55,450
As % of all permanent jobs advertised in the UK excluding London 92.65% 82.37% 95.58%
Number of salaries quoted 17,392 42,187 28,711
10th Percentile £26,250 £27,250 £30,500
25th Percentile £36,750 £36,250 £40,000
Median annual salary (50th Percentile) £51,574 £50,000 £55,000
Median % change year-on-year +3.15% -9.09% +4.76%
75th Percentile £65,000 £65,000 £70,000
90th Percentile £77,500 £77,500 £82,500
UK median annual salary £57,443 £55,000 £60,899
% change year-on-year +4.44% -9.69% +1.50%

Collaborative Culture
Job Vacancy Trend in the UK excluding London

Job postings citing Collaborative Culture as a proportion of all IT jobs advertised in the UK excluding London.
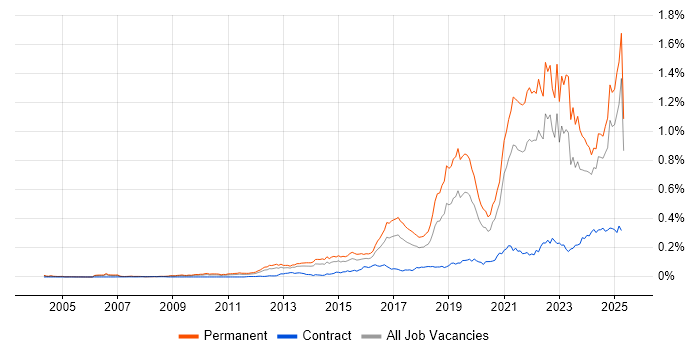
Job vacancy trend for Collaborative Culture in the UK excluding London

Collaborative Culture
Salary Trend in the UK excluding London

3-month moving average salary quoted in jobs citing Collaborative Culture in the UK excluding London.

Salary trend for Collaborative Culture in the UK excluding London

Collaborative Culture
Salary Histogram in the UK excluding London

Salary distribution for jobs citing Collaborative Culture in the UK excluding London over the 6 months to 30 May 2025.

Salary histogram for Collaborative Culture in the UK excluding London

Collaborative Culture
Job Locations in the UK excluding London

The table below looks at the demand and provides a guide to the median salaries quoted in IT jobs citing Collaborative Culture within the UK excluding London region over the 6 months to 30 May 2025. The 'Rank Change' column provides an indication of the change in demand within each location based on the same 6 month period last year.

Location Rank Change
on Same Period
Last Year
Matching
Permanent
IT Job Ads
Median Salary
Past 6 Months
Median Salary
% Change
on Same Period
Last Year
Live
Jobs
South East +164 227 £55,000 -15.38% 1,665
North of England -15 162 £57,560 -14.73% 1,275
East of England +67 110 £57,000 +42.50% 827
North West -21 103 £57,560 -9.71% 591
Midlands +53 74 £46,000 -23.33% 1,075
West Midlands +44 53 £45,500 -24.17% 566
South West +86 48 £47,500 -9.52% 714
Yorkshire +9 47 £52,500 -22.22% 522
Scotland +108 28 £50,000 -10.90% 265
East Midlands +26 19 £47,500 -5.00% 439
North East +44 12 £61,000 -9.63% 163
Wales +32 9 £50,000 -9.09% 165
Northern Ireland +48 6 - - 79
Collaborative Culture
UK

Collaborative Culture
Co-occurring Skills and Capabilities in the UK excluding London by Category

The follow tables expand on the table above by listing co-occurrences grouped by category. The same employment type, locality and period is covered with up to 20 co-occurrences shown in each of the following categories:

Application Platforms
1 15 (2.26%) Apache Spark
2 13 (1.96%) SharePoint
3 12 (1.81%) Microsoft Exchange
4 8 (1.20%) CMS
4 8 (1.20%) Confluence
5 7 (1.05%) IIS
6 3 (0.45%) Umbraco
7 2 (0.30%) Apache Airflow
7 2 (0.30%) Skype for Business
8 1 (0.15%) Apache
8 1 (0.15%) BizTalk Server
8 1 (0.15%) Headless CMS
8 1 (0.15%) Jupyter
8 1 (0.15%) Strapi
8 1 (0.15%) Tomcat
Applications
1 13 (1.96%) Microsoft Excel
2 3 (0.45%) Microsoft Office
3 2 (0.30%) Adobe XD
3 2 (0.30%) Microsoft PowerPoint
4 1 (0.15%) Microsoft Project
4 1 (0.15%) MS Visio
4 1 (0.15%) Oracle Smart View
4 1 (0.15%) Sketch
4 1 (0.15%) Trello
Business Applications
1 4 (0.60%) Dynamics CRM
2 3 (0.45%) Maximo
2 3 (0.45%) Sage 50
3 2 (0.30%) Infor M3
3 2 (0.30%) Salesforce CRM
4 1 (0.15%) Shopify
Cloud Services
1 100 (15.06%) Azure
2 89 (13.40%) AWS
3 54 (8.13%) SaaS
4 26 (3.92%) Microsoft 365
5 25 (3.77%) Power Platform
6 24 (3.61%) GCP
6 24 (3.61%) Serverless
7 22 (3.31%) AWS Lambda
8 16 (2.41%) Azure DevOps
9 15 (2.26%) Amazon CloudWatch
9 15 (2.26%) Boomi
10 14 (2.11%) Amazon EventBridge
10 14 (2.11%) Amazon SQS
10 14 (2.11%) AWS CodeBuild
10 14 (2.11%) AWS CodeDeploy
10 14 (2.11%) AWS CodePipeline
10 14 (2.11%) AWS Step Functions
10 14 (2.11%) Entra ID
10 14 (2.11%) Salsify
11 12 (1.81%) Cloud Computing
Communications & Networking
1 25 (3.77%) Firewall
2 15 (2.26%) Broadband
2 15 (2.26%) DNS
3 12 (1.81%) VPN
4 10 (1.51%) DHCP
5 9 (1.36%) WAN
6 6 (0.90%) Network Security
6 6 (0.90%) VLAN
7 5 (0.75%) TCP/IP
7 5 (0.75%) VoIP
8 4 (0.60%) 5G
8 4 (0.60%) HTTPS
8 4 (0.60%) Internet
8 4 (0.60%) LAN
8 4 (0.60%) SD-WAN
9 3 (0.45%) Modbus
9 3 (0.45%) RS-485
9 3 (0.45%) SAN
10 2 (0.30%) Bluetooth
10 2 (0.30%) Skype
Database & Business Intelligence
1 36 (5.42%) SQL Server
2 27 (4.07%) Big Data
3 23 (3.46%) MySQL
3 23 (3.46%) Power BI
4 15 (2.26%) Data Warehouse
4 15 (2.26%) Metadata
4 15 (2.26%) PostgreSQL
5 13 (1.96%) Data Lake
5 13 (1.96%) NoSQL
6 10 (1.51%) Hadoop
7 9 (1.36%) Amazon RDS
7 9 (1.36%) Relational Database
7 9 (1.36%) Tableau
8 7 (1.05%) Elasticsearch
9 5 (0.75%) MariaDB
9 5 (0.75%) Redis
10 4 (0.60%) Data Hub
10 4 (0.60%) GIS
10 4 (0.60%) RDBMS
10 4 (0.60%) SQL CLR
Development Applications
1 30 (4.52%) JIRA
2 15 (2.26%) Git
3 7 (1.05%) Visual Studio
4 6 (0.90%) Postman
5 5 (0.75%) GitLab
5 5 (0.75%) JMeter
6 4 (0.60%) Appium
6 4 (0.60%) CppUnit
6 4 (0.60%) Fiddler
6 4 (0.60%) LoadRunner
6 4 (0.60%) Rational DOORS
6 4 (0.60%) Selenium
7 2 (0.30%) Jenkins
7 2 (0.30%) Rational Rhapsody
8 1 (0.15%) Gatling
8 1 (0.15%) Katalon Studio
8 1 (0.15%) SoapUI
8 1 (0.15%) SpecFlow
8 1 (0.15%) SQL Server Management Studio (SSMS)
8 1 (0.15%) TeamCity
General
1 428 (64.46%) Social Skills
2 309 (46.54%) Finance
3 261 (39.31%) Marketing
4 235 (35.39%) Public Sector
5 85 (12.80%) Analytical Skills
6 59 (8.89%) Law
7 40 (6.02%) Legal
8 30 (4.52%) Aerospace
9 28 (4.22%) Retail
10 20 (3.01%) Inclusion and Diversity
11 16 (2.41%) Presentation Skills
12 14 (2.11%) Influencing Skills
13 13 (1.96%) Organisational Skills
14 11 (1.66%) Electronics
14 11 (1.66%) Manufacturing
15 9 (1.36%) Back Office
15 9 (1.36%) Documentation Skills
15 9 (1.36%) Telecoms
16 7 (1.05%) Banking
17 6 (0.90%) Local Government
Job Titles
1 208 (31.33%) Business Manager
1 208 (31.33%) Development Manager
2 205 (30.87%) Business Development Manager
3 89 (13.40%) Lead
4 55 (8.28%) Senior
5 53 (7.98%) Developer
6 32 (4.82%) Analyst
7 23 (3.46%) Operations Manager
8 22 (3.31%) Risk Manager
9 19 (2.86%) Architect
10 15 (2.26%) Senior Manager
11 13 (1.96%) Infrastructure Engineer
12 12 (1.81%) Embedded Engineer
12 12 (1.81%) Software Engineer
13 10 (1.51%) Consultant
13 10 (1.51%) Full-Stack Developer
13 10 (1.51%) Junior
13 10 (1.51%) Senior Developer
14 9 (1.36%) Marketing Manager
14 9 (1.36%) Service Manager
Libraries, Frameworks & Software Standards
1 32 (4.82%) .NET
2 27 (4.07%) RESTful
3 19 (2.86%) Kafka
4 15 (2.26%) OAuth
5 14 (2.11%) JWT
6 13 (1.96%) React
7 11 (1.66%) AngularJS
8 9 (1.36%) .NET Core
8 9 (1.36%) ASP.NET
8 9 (1.36%) Spring
8 9 (1.36%) Web Services
9 8 (1.20%) .NET Framework
9 8 (1.20%) HTML
9 8 (1.20%) REST
9 8 (1.20%) Spring Boot
10 7 (1.05%) Node.js
11 6 (0.90%) ASP.NET MVC
11 6 (0.90%) CSS
11 6 (0.90%) Material-UI
12 5 (0.75%) Entity Framework
Miscellaneous
1 30 (4.52%) Management Information System
2 27 (4.07%) Cloud Native
3 19 (2.86%) Self-Motivation
4 15 (2.26%) Taxonomies
5 13 (1.96%) Product Ownership
6 11 (1.66%) Algorithms
6 11 (1.66%) Team-Oriented Environment
7 10 (1.51%) Enterprise Software
7 10 (1.51%) Learning Management System
7 10 (1.51%) Public Cloud
8 9 (1.36%) Cyber Threat
8 9 (1.36%) Legacy Systems
9 7 (1.05%) Data Structures
9 7 (1.05%) Embedded Systems
9 7 (1.05%) Private Cloud
9 7 (1.05%) Security Operations Centre
10 6 (0.90%) Data Centre
10 6 (0.90%) Hybrid Cloud
10 6 (0.90%) Marketing Technology
10 6 (0.90%) Social Media
Operating Systems
1 48 (7.23%) Windows
2 42 (6.33%) Linux
3 26 (3.92%) Windows Server
4 4 (0.60%) Ubuntu
4 4 (0.60%) Unix
5 3 (0.45%) CentOS
5 3 (0.45%) Embedded Linux
5 3 (0.45%) Mac OS
6 2 (0.30%) Red Hat Enterprise Linux
6 2 (0.30%) Windows Server 2003
6 2 (0.30%) Windows Server 2019
7 1 (0.15%) Android
7 1 (0.15%) Apple iOS
7 1 (0.15%) FreeRTOS
7 1 (0.15%) SafeRTOS
7 1 (0.15%) Windows Server 2016
Processes & Methodologies
1 223 (33.58%) Collaborative Working
2 222 (33.43%) Business Development
3 210 (31.63%) Marketing Strategy
4 204 (30.72%) Facilities Management
5 175 (26.36%) Continuous Improvement
6 143 (21.54%) Problem-Solving
7 133 (20.03%) Agile
8 79 (11.90%) Analytics
9 74 (11.14%) DevOps
10 69 (10.39%) Project Management
11 66 (9.94%) Artificial Intelligence
11 66 (9.94%) Software Engineering
12 64 (9.64%) Decision-Making
13 58 (8.73%) CI/CD
14 55 (8.28%) Roadmaps
15 52 (7.83%) Mentoring
16 50 (7.53%) Stakeholder Management
17 43 (6.48%) Business Intelligence
18 42 (6.33%) Computer Science
19 41 (6.17%) Risk Management
Programming Languages
1 93 (14.01%) SQL
2 73 (10.99%) Java
3 53 (7.98%) Python
4 46 (6.93%) C#
5 43 (6.48%) JavaScript
6 23 (3.46%) PowerShell
7 18 (2.71%) Bash
8 15 (2.26%) C
9 12 (1.81%) PHP
10 11 (1.66%) TypeScript
11 9 (1.36%) C++
12 7 (1.05%) T-SQL
13 6 (0.90%) PL/SQL
14 4 (0.60%) Shell Script
15 3 (0.45%) Perl
16 2 (0.30%) MATLAB
16 2 (0.30%) R
16 2 (0.30%) Ruby
17 1 (0.15%) Apex Code
17 1 (0.15%) Scala
Qualifications
1 111 (16.72%) Degree
2 34 (5.12%) Security Cleared
3 27 (4.07%) Computer Science Degree
4 20 (3.01%) Azure Certification
5 19 (2.86%) AWS Certification
5 19 (2.86%) CompTIA Security+
6 18 (2.71%) CISSP
7 16 (2.41%) Cisco Certification
8 12 (1.81%) (ISC)2 CCSP
8 12 (1.81%) CISA
8 12 (1.81%) DV Cleared
8 12 (1.81%) ISO 27001 Lead Auditor
9 11 (1.66%) Master's Degree
9 11 (1.66%) Microsoft Certification
10 7 (1.05%) GCIH
10 7 (1.05%) SC Cleared
11 6 (0.90%) MRICS
11 6 (0.90%) Numerate Degree
12 5 (0.75%) DBS Check
12 5 (0.75%) ISTQB
Quality Assurance & Compliance
1 30 (4.52%) GDPR
2 25 (3.77%) ISO/IEC 27001
3 24 (3.61%) QA
4 22 (3.31%) Data Quality
5 20 (3.01%) California Consumer Privacy Act
6 12 (1.81%) Sarbanes-Oxley
7 8 (1.20%) NIST
8 5 (0.75%) HIPAA
8 5 (0.75%) PCI DSS
9 3 (0.45%) 21 CFR Part 11
9 3 (0.45%) Good Clinical Practice
9 3 (0.45%) SLA
10 2 (0.30%) PMO
11 1 (0.15%) Cyber Essentials
11 1 (0.15%) ECSS
11 1 (0.15%) GRC
11 1 (0.15%) IEC 62304
11 1 (0.15%) IFRS
11 1 (0.15%) ISO 26262
11 1 (0.15%) SOC 2
System Software
1 30 (4.52%) Active Directory
2 22 (3.31%) Docker
3 16 (2.41%) VMware Infrastructure
4 10 (1.51%) Hyper-V
5 6 (0.90%) Virtual Machines
6 5 (0.75%) Embedded Firmware
6 5 (0.75%) Firmware
7 3 (0.45%) Dovecot
7 3 (0.45%) Postfix
8 2 (0.30%) vSphere
9 1 (0.15%) NFS
9 1 (0.15%) VMware ESXi
Systems Management
1 20 (3.01%) Kubernetes
1 20 (3.01%) Terraform
2 14 (2.11%) Ansible
3 8 (1.20%) Microsoft Intune
4 6 (0.90%) Progress Chef
5 4 (0.60%) Prometheus
5 4 (0.60%) SCOM
6 3 (0.45%) Grafana
6 3 (0.45%) SCCM
7 2 (0.30%) Puppet
7 2 (0.30%) SCOrch
7 2 (0.30%) SCSM
8 1 (0.15%) Argo
8 1 (0.15%) Panaseer
Vendors
1 67 (10.09%) Microsoft
2 40 (6.02%) Oracle
3 29 (4.37%) Salesforce
4 18 (2.71%) Google
4 18 (2.71%) ServiceNow
4 18 (2.71%) VMware
5 16 (2.41%) MuleSoft
6 15 (2.26%) Informatica
7 10 (1.51%) Cisco
8 5 (0.75%) Dell
8 5 (0.75%) Red Hat
9 4 (0.60%) HubSpot
9 4 (0.60%) Meraki
9 4 (0.60%) SAP
9 4 (0.60%) Veeam
10 3 (0.45%) Acronis
10 3 (0.45%) Ahrefs
10 3 (0.45%) Kaseya
10 3 (0.45%) Okta
10 3 (0.45%) Ping Identity