Platform Engineering Jobs in the UK excluding London

Platform Engineering
UK > UK excluding London

The table below provides summary statistics for permanent job vacancies advertised in the UK excluding London requiring Platform Engineering skills. It includes a benchmarking guide to the annual salaries offered in vacancies that cited Platform Engineering over the 6 months leading up to 9 June 2025, comparing them to the same period in the previous two years.

6 months to
9 Jun 2025
Same period 2024 Same period 2023
Rank 231 318 411
Rank change year-on-year +87 +93 -43
Permanent jobs citing Platform Engineering 515 572 379
As % of all permanent jobs advertised in the UK excluding London 1.29% 0.73% 0.68%
As % of the Processes & Methodologies category 1.40% 0.90% 0.71%
Number of salaries quoted 167 184 303
10th Percentile £40,748 £39,223 £42,819
25th Percentile £56,176 £52,500 £52,500
Median annual salary (50th Percentile) £65,000 £65,000 £67,500
Median % change year-on-year - -3.70% +12.50%
75th Percentile £77,500 £72,500 £80,000
90th Percentile £87,500 £91,750 £95,000
UK median annual salary £72,500 £75,000 £75,000
% change year-on-year -3.33% - +3.45%

All Process and Methodology Skills
UK excluding London

Platform Engineering falls under the Processes and Methodologies category. For comparison with the information above, the following table provides summary statistics for all permanent job vacancies requiring process or methodology skills in the UK excluding London.

Permanent vacancies with a requirement for process or methodology skills 36,702 63,852 53,209
As % of all permanent jobs advertised in the UK excluding London 91.70% 81.13% 95.50%
Number of salaries quoted 17,877 43,309 28,442
10th Percentile £26,250 £27,500 £30,500
25th Percentile £35,750 £36,250 £40,000
Median annual salary (50th Percentile) £50,890 £50,000 £55,000
Median % change year-on-year +1.78% -9.09% +4.76%
75th Percentile £65,000 £65,000 £70,000
90th Percentile £77,500 £77,500 £82,500
UK median annual salary £56,000 £55,000 £60,800
% change year-on-year +1.82% -9.54% +1.33%

Platform Engineering
Job Vacancy Trend in the UK excluding London

Job postings citing Platform Engineering as a proportion of all IT jobs advertised in the UK excluding London.
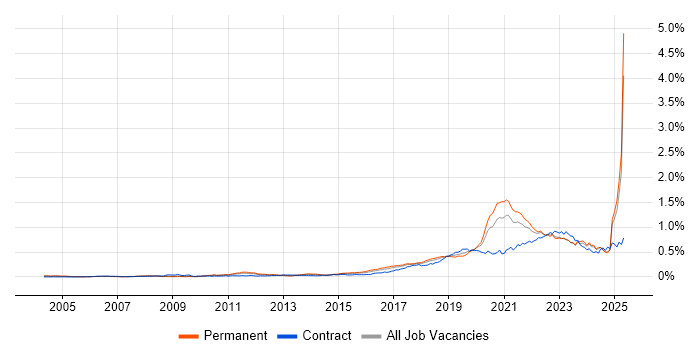
Job vacancy trend for Platform Engineering in the UK excluding London

Platform Engineering
Salary Trend in the UK excluding London

3-month moving average salary quoted in jobs citing Platform Engineering in the UK excluding London.

Salary trend for Platform Engineering in the UK excluding London

Platform Engineering
Salary Histogram in the UK excluding London

Salary distribution for jobs citing Platform Engineering in the UK excluding London over the 6 months to 9 June 2025.

Salary histogram for Platform Engineering in the UK excluding London

Platform Engineering
Job Locations in the UK excluding London

The table below looks at the demand and provides a guide to the median salaries quoted in IT jobs citing Platform Engineering within the UK excluding London region over the 6 months to 9 June 2025. The 'Rank Change' column provides an indication of the change in demand within each location based on the same 6 month period last year.

Location Rank Change
on Same Period
Last Year
Matching
Permanent
IT Job Ads
Median Salary
Past 6 Months
Median Salary
% Change
on Same Period
Last Year
Live
Jobs
North of England +112 362 £57,560 -4.07% 149
North West +134 342 £57,560 -11.45% 101
South East +48 90 £52,500 -22.22% 204
Midlands +40 32 £72,500 +20.83% 41
West Midlands +47 23 £71,250 +9.62% 19
Yorkshire -8 19 £65,000 +18.18% 37
Scotland +71 11 £75,360 +3.94% 15
South West +33 11 £87,319 +29.36% 39
East Midlands +23 9 £100,000 +66.67% 20
East of England +24 6 £80,000 - 36
Wales +34 3 £37,733 -29.80% 6
North East +26 1 £75,500 -5.63% 12
Platform Engineering
UK

Platform Engineering
Co-occurring Skills and Capabilities in the UK excluding London by Category

The follow tables expand on the table above by listing co-occurrences grouped by category. The same employment type, locality and period is covered with up to 20 co-occurrences shown in each of the following categories:

Application Platforms
1 11 (2.14%) Apache Spark
2 8 (1.55%) Confluence
3 7 (1.36%) IBM Domino
3 7 (1.36%) Microsoft Exchange
4 6 (1.17%) Apache
5 4 (0.78%) Apache Airflow
6 3 (0.58%) nginx
7 2 (0.39%) OpenStack
8 1 (0.19%) Jupyter
Applications
1 6 (1.17%) Mozilla Thunderbird
Business Applications
1 65 (12.62%) Sparx Enterprise Architect
1 65 (12.62%) Teamcenter
2 1 (0.19%) Dynamics CRM
Cloud Services
1 95 (18.45%) AWS
2 90 (17.48%) Azure
3 41 (7.96%) GCP
4 30 (5.83%) Amazon S3
5 24 (4.66%) Amazon EC2
6 21 (4.08%) GitHub
7 20 (3.88%) Azure Monitor
8 18 (3.50%) Virtual Private Cloud
9 16 (3.11%) AWS Lambda
9 16 (3.11%) Serverless
10 14 (2.72%) Azure DevOps
11 13 (2.52%) Microsoft 365
12 12 (2.33%) Amazon ECS
13 11 (2.14%) Amazon CloudWatch
13 11 (2.14%) Amazon ELB
13 11 (2.14%) AWS KMS
13 11 (2.14%) Entra ID
14 9 (1.75%) AWS CloudFormation
15 8 (1.55%) Amazon Glacier
15 8 (1.55%) Power Platform
Communications & Networking
1 268 (52.04%) VPN
2 267 (51.84%) Cisco IOS
3 18 (3.50%) Firewall
4 16 (3.11%) DNS
5 7 (1.36%) FTP
5 7 (1.36%) HTTP
5 7 (1.36%) LAN
5 7 (1.36%) SMTP
5 7 (1.36%) SSH
5 7 (1.36%) WAN
6 3 (0.58%) IMAP
6 3 (0.58%) OpenLDAP
6 3 (0.58%) SSL
7 2 (0.39%) Internet
7 2 (0.39%) TCP/IP
8 1 (0.19%) Asterisk PBX
8 1 (0.19%) DHCP
8 1 (0.19%) MPLS
8 1 (0.19%) Multicast
8 1 (0.19%) VXLAN
Database & Business Intelligence
1 16 (3.11%) Amazon RDS
2 14 (2.72%) Data Lake
3 11 (2.14%) Big Data
3 11 (2.14%) Hadoop
4 9 (1.75%) Data Warehouse
4 9 (1.75%) NoSQL
5 8 (1.55%) PostgreSQL
6 5 (0.97%) SQL Server
7 4 (0.78%) Amazon Aurora
7 4 (0.78%) DynamoDB
7 4 (0.78%) Elasticsearch
7 4 (0.78%) Power BI
8 3 (0.58%) Azure SQL Database
8 3 (0.58%) MySQL
9 2 (0.39%) Apache Hive
9 2 (0.39%) Bigtable
9 2 (0.39%) HBase
9 2 (0.39%) MongoDB
9 2 (0.39%) Redis
9 2 (0.39%) Tableau
Development Applications
1 65 (12.62%) Rational DOORS
2 30 (5.83%) Jenkins
3 11 (2.14%) Git
3 11 (2.14%) Vagrant
4 10 (1.94%) JIRA
5 8 (1.55%) TeamCity
6 7 (1.36%) GitLab
7 3 (0.58%) Bitbucket Server
7 3 (0.58%) Sonatype Nexus
8 2 (0.39%) Artifactory
9 1 (0.19%) Atlassian Bamboo
9 1 (0.19%) Cypress.io
9 1 (0.19%) Octopus Deploy
9 1 (0.19%) Oracle Forms
9 1 (0.19%) Vite
9 1 (0.19%) webpack
General
1 267 (51.84%) Inclusion and Diversity
2 266 (51.65%) Analytical Skills
3 78 (15.15%) Social Skills
4 55 (10.68%) Law
5 40 (7.77%) Finance
6 13 (2.52%) Legal
7 10 (1.94%) Public Sector
8 7 (1.36%) Presentation Skills
9 5 (0.97%) Banking
10 4 (0.78%) Manufacturing
11 2 (0.39%) Advertising
11 2 (0.39%) Electronics
12 1 (0.19%) Aviation
12 1 (0.19%) Games
12 1 (0.19%) Marketing
Job Titles
1 263 (51.07%) Infrastructure Engineer
2 125 (24.27%) Platform Engineer
3 78 (15.15%) Systems Engineer
4 43 (8.35%) Senior
5 40 (7.77%) Lead
6 21 (4.08%) Cloud Engineer
6 21 (4.08%) DevOps Engineer
7 13 (2.52%) Cloud Platform Engineer
7 13 (2.52%) Senior Manager
8 11 (2.14%) Support Engineer
9 10 (1.94%) AWS Engineer
10 9 (1.75%) AWS Platform Engineer
10 9 (1.75%) Data Analytics Director
10 9 (1.75%) Senior Platform Engineer
11 7 (1.36%) Azure Engineer
11 7 (1.36%) Platform Support Engineer
11 7 (1.36%) Senior Cloud Engineer
12 6 (1.17%) DevOps Platform Engineer
12 6 (1.17%) Site Reliability Engineer
12 6 (1.17%) Software Engineer
Libraries, Frameworks & Software Standards
1 260 (50.49%) Elastic Stack
2 16 (3.11%) Kafka
3 13 (2.52%) Hugging Face
3 13 (2.52%) LangChain
3 13 (2.52%) PyTorch
3 13 (2.52%) TensorFlow
4 11 (2.14%) .NET
5 10 (1.94%) REST
6 9 (1.75%) ADO
7 8 (1.55%) Spring Boot
8 7 (1.36%) Spring
8 7 (1.36%) YAML
9 6 (1.17%) Loki
9 6 (1.17%) Node.js
9 6 (1.17%) React
10 5 (0.97%) AWS CDK
11 4 (0.78%) .NET Framework
12 3 (0.58%) ASP.NET
12 3 (0.58%) ASP.NET MVC
12 3 (0.58%) Java EE
Miscellaneous
1 260 (50.49%) Cyberattack
2 66 (12.82%) Product Ownership
3 22 (4.27%) Cloud Native
4 21 (4.08%) Enterprise Software
5 9 (1.75%) Management Information System
5 9 (1.75%) Public Cloud
6 6 (1.17%) Distributed Systems
7 5 (0.97%) Greenfield Project
7 5 (0.97%) Hybrid Cloud
7 5 (0.97%) Virtual Team
8 4 (0.78%) Data Centre
8 4 (0.78%) Replication
9 2 (0.39%) Low-Code
9 2 (0.39%) Private Cloud
10 1 (0.19%) Algorithms
10 1 (0.19%) Analytical Mindset
10 1 (0.19%) IoT
10 1 (0.19%) Linux Command Line
Operating Systems
1 293 (56.89%) Linux
2 279 (54.17%) Windows
3 268 (52.04%) Android
4 11 (2.14%) VMS
5 8 (1.55%) Amazon Linux
6 7 (1.36%) Mac OS
6 7 (1.36%) Ubuntu
7 6 (1.17%) Red Hat Enterprise Linux
8 2 (0.39%) Unix
8 2 (0.39%) Windows Server
9 1 (0.19%) Debian
9 1 (0.19%) Solaris
Processes & Methodologies
1 331 (64.27%) DevOps
2 289 (56.12%) Problem-Solving
3 272 (52.82%) Infrastructure Engineering
4 269 (52.23%) Task Automation
5 263 (51.07%) Line Management
5 263 (51.07%) Risk Management
6 261 (50.68%) Mathematics
6 261 (50.68%) Storage Management
7 113 (21.94%) Agile
8 82 (15.92%) Stakeholder Engagement
9 74 (14.37%) CI/CD
10 65 (12.62%) ArchiMate
10 65 (12.62%) MODAF
10 65 (12.62%) Model-Based Systems Engineering
10 65 (12.62%) Programme Delivery
10 65 (12.62%) SysML
10 65 (12.62%) TOGAF
11 58 (11.26%) Infrastructure as Code
12 52 (10.10%) Computer Science
13 44 (8.54%) Analytics
Programming Languages
1 332 (64.47%) Python
2 289 (56.12%) PowerShell
3 286 (55.53%) Bash
4 24 (4.66%) Java
4 24 (4.66%) SQL
5 19 (3.69%) Bicep
6 13 (2.52%) Ruby
7 12 (2.33%) TypeScript
8 11 (2.14%) Groovy
8 11 (2.14%) JavaScript
9 10 (1.94%) C#
10 9 (1.75%) Perl
11 4 (0.78%) Go
12 3 (0.58%) Clojure
12 3 (0.58%) Elixir
12 3 (0.58%) PHP
12 3 (0.58%) Rust
12 3 (0.58%) Scala
12 3 (0.58%) Shell Script
13 2 (0.39%) C++
Qualifications
1 123 (23.88%) Degree
2 74 (14.37%) BPSS Clearance
3 65 (12.62%) TOGAF Certification
4 30 (5.83%) Security Cleared
5 29 (5.63%) SC Cleared
6 26 (5.05%) Computer Science Degree
6 26 (5.05%) Master's Degree
7 16 (3.11%) Azure Certification
8 14 (2.72%) AWS Certification
9 9 (1.75%) HNC
10 5 (0.97%) DV Cleared
11 4 (0.78%) Microsoft Certification
12 1 (0.19%) (ISC)2 CCSP
12 1 (0.19%) CCSP
12 1 (0.19%) Cisco Certification
12 1 (0.19%) CISSP
Quality Assurance & Compliance
1 10 (1.94%) GDPR
2 9 (1.75%) California Consumer Privacy Act
3 8 (1.55%) Accessibility
4 4 (0.78%) Data Quality
5 3 (0.58%) QA
6 1 (0.19%) ISO/IEC 27001
6 1 (0.19%) NIST
6 1 (0.19%) PCI DSS
System Software
1 301 (58.45%) Docker
2 264 (51.26%) Hyper-V
3 261 (50.68%) vSphere
4 260 (50.49%) VMware NSX
5 20 (3.88%) Active Directory
6 10 (1.94%) Virtual Machines
7 5 (0.97%) Virtual Desktop
8 4 (0.78%) DFS Replication
8 4 (0.78%) VMware Infrastructure
9 3 (0.58%) Dovecot
9 3 (0.58%) Postfix
9 3 (0.58%) Squid
10 2 (0.39%) HDFS
11 1 (0.19%) Veritas Cluster Server
Systems Management
1 332 (64.47%) Terraform
2 303 (58.83%) Ansible
3 42 (8.16%) Kubernetes
4 31 (6.02%) Grafana
5 30 (5.83%) Prometheus
6 15 (2.91%) Puppet
7 12 (2.33%) Progress Chef
8 6 (1.17%) Nessus
8 6 (1.17%) Proxmox
9 4 (0.78%) SCCM
10 3 (0.58%) Argo
10 3 (0.58%) Nagios
11 2 (0.39%) AWS Copilot
11 2 (0.39%) Hadoop YARN
11 2 (0.39%) Podman
11 2 (0.39%) Rancher
12 1 (0.19%) Microsoft Data Protection Manager
12 1 (0.19%) SCOM
12 1 (0.19%) WSUS
Vendors
1 267 (51.84%) Cisco
2 263 (51.07%) Juniper
3 260 (50.49%) 3PAR
3 260 (50.49%) Splunk
4 65 (12.62%) Sparx
5 26 (5.05%) Microsoft
6 14 (2.72%) Google
7 13 (2.52%) OpenAI
8 8 (1.55%) ServiceNow
9 7 (1.36%) Databricks
9 7 (1.36%) Palo Alto
9 7 (1.36%) VMware
10 5 (0.97%) Atlassian
10 5 (0.97%) Oracle
11 4 (0.78%) IBM
11 4 (0.78%) IBM Sterling
12 3 (0.58%) Jaspersoft
13 2 (0.39%) Cloudera
13 2 (0.39%) MapR
13 2 (0.39%) WSO2