Software Engineering Jobs in the UK excluding London

Software Engineering
UK > UK excluding London

The table below provides summary statistics for permanent job vacancies advertised in the UK excluding London requiring Software Engineering skills. It includes a benchmarking guide to the annual salaries offered in vacancies that cited Software Engineering over the 6 months leading up to 1 June 2025, comparing them to the same period in the previous two years.

6 months to
1 Jun 2025
Same period 2024 Same period 2023
Rank 15 10 23
Rank change year-on-year -5 +13 -9
Permanent jobs citing Software Engineering 3,634 9,395 5,426
As % of all permanent jobs advertised in the UK excluding London 9.12% 12.45% 9.53%
As % of the Processes & Methodologies category 9.86% 15.17% 9.98%
Number of salaries quoted 2,083 5,356 3,108
10th Percentile £41,000 £37,500 £37,500
25th Percentile £50,000 £45,000 £47,500
Median annual salary (50th Percentile) £58,033 £57,500 £60,000
Median % change year-on-year +0.93% -4.17% +4.35%
75th Percentile £72,500 £70,000 £77,500
90th Percentile £91,797 £82,500 £90,000
UK median annual salary £66,206 £60,500 £70,000
% change year-on-year +9.43% -13.57% +1.10%

All Process and Methodology Skills
UK excluding London

Software Engineering falls under the Processes and Methodologies category. For comparison with the information above, the following table provides summary statistics for all permanent job vacancies requiring process or methodology skills in the UK excluding London.

Permanent vacancies with a requirement for process or methodology skills 36,855 61,920 54,393
As % of all permanent jobs advertised in the UK excluding London 92.49% 82.05% 95.50%
Number of salaries quoted 17,649 42,417 28,632
10th Percentile £26,250 £27,250 £30,500
25th Percentile £36,250 £36,250 £40,000
Median annual salary (50th Percentile) £51,500 £50,000 £55,000
Median % change year-on-year +3.00% -9.09% +4.76%
75th Percentile £65,000 £65,000 £70,000
90th Percentile £77,500 £77,500 £82,500
UK median annual salary £56,500 £55,000 £60,899
% change year-on-year +2.73% -9.69% +1.50%

Software Engineering
Job Vacancy Trend in the UK excluding London

Job postings citing Software Engineering as a proportion of all IT jobs advertised in the UK excluding London.
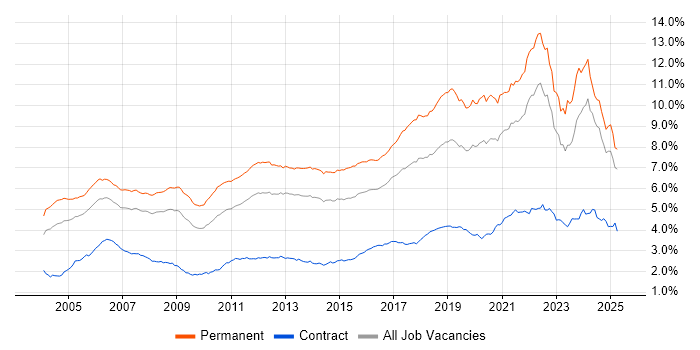
Job vacancy trend for Software Engineering in the UK excluding London

Software Engineering
Salary Trend in the UK excluding London

3-month moving average salary quoted in jobs citing Software Engineering in the UK excluding London.

Salary trend for Software Engineering in the UK excluding London

Software Engineering
Salary Histogram in the UK excluding London

Salary distribution for jobs citing Software Engineering in the UK excluding London over the 6 months to 1 June 2025.

Salary histogram for Software Engineering in the UK excluding London

Software Engineering
Job Locations in the UK excluding London

The table below looks at the demand and provides a guide to the median salaries quoted in IT jobs citing Software Engineering within the UK excluding London region over the 6 months to 1 June 2025. The 'Rank Change' column provides an indication of the change in demand within each location based on the same 6 month period last year.

Location Rank Change
on Same Period
Last Year
Matching
Permanent
IT Job Ads
Median Salary
Past 6 Months
Median Salary
% Change
on Same Period
Last Year
Live
Jobs
North of England -6 1,082 £57,836 +0.58% 4,571
North West -9 799 £55,000 -8.33% 2,226
Scotland -3 628 £58,033 -3.28% 1,068
South East -16 616 £65,000 +18.18% 5,401
Midlands -6 498 £65,000 +18.18% 3,765
South West 0 470 £52,600 -4.36% 2,454
West Midlands -3 304 £65,000 +8.33% 2,007
East of England -27 258 £60,000 - 3,088
Yorkshire -12 221 £67,750 +23.18% 1,767
East Midlands -18 194 £65,000 +30.00% 1,514
Wales -9 75 £65,000 +30.00% 546
North East +4 62 £55,000 - 588
Northern Ireland -14 10 £90,000 +50.00% 392
Software Engineering
UK

Software Engineering
Co-occurring Skills and Capabilities in the UK excluding London by Category

The follow tables expand on the table above by listing co-occurrences grouped by category. The same employment type, locality and period is covered with up to 20 co-occurrences shown in each of the following categories:

Application Platforms
1 202 (5.56%) Confluence
2 39 (1.07%) Apache
3 24 (0.66%) Jupyter
4 22 (0.61%) Apache Spark
5 12 (0.33%) Kinematics
5 12 (0.33%) SharePoint
6 11 (0.30%) Apache Airflow
7 10 (0.28%) CMS
8 7 (0.19%) IIS
8 7 (0.19%) Microsoft Exchange
9 5 (0.14%) OpenStack
10 4 (0.11%) Appian
10 4 (0.11%) Camunda
10 4 (0.11%) Oracle Workflow
11 3 (0.083%) Adobe Experience Manager
11 3 (0.083%) Tomcat
12 2 (0.055%) CICS
12 2 (0.055%) Cloud Foundry
12 2 (0.055%) Sitefinity
12 2 (0.055%) TPMS
Applications
1 592 (16.29%) Simulink
2 53 (1.46%) Chatbot
3 13 (0.36%) Microsoft Excel
4 7 (0.19%) Microsoft Office
5 4 (0.11%) Microsoft PowerPoint
5 4 (0.11%) Microsoft Project
6 3 (0.083%) Sketch
7 2 (0.055%) Adobe XD
7 2 (0.055%) GNU Octave
7 2 (0.055%) MS Visio
8 1 (0.028%) Adobe Creative Suite
8 1 (0.028%) CANalyzer
8 1 (0.028%) CATIA
8 1 (0.028%) S-PLUS
8 1 (0.028%) Trello
Business Applications
1 8 (0.22%) Magento
1 8 (0.22%) Shopify
2 7 (0.19%) Q-Pulse
3 2 (0.055%) Payment Gateway
4 1 (0.028%) BASE24
4 1 (0.028%) iTrent
4 1 (0.028%) LabWindows
4 1 (0.028%) Oracle ERP
4 1 (0.028%) Sage 200
4 1 (0.028%) Sparx Enterprise Architect
4 1 (0.028%) Teamcenter
Cloud Services
1 976 (26.86%) AWS
2 892 (24.55%) Azure
3 543 (14.94%) GCP
4 103 (2.83%) GitHub
5 95 (2.61%) SaaS
6 89 (2.45%) Serverless
7 77 (2.12%) Azure DevOps
8 59 (1.62%) Amazon EKS
9 52 (1.43%) GitHub Actions
10 51 (1.40%) Amazon S3
11 48 (1.32%) AWS CloudFormation
12 46 (1.27%) AWS Lambda
13 42 (1.16%) Power Platform
14 38 (1.05%) Azure Synapse Analytics
15 32 (0.88%) Amazon EC2
16 27 (0.74%) Azure Data Factory
16 27 (0.74%) Snowflake
17 26 (0.72%) Cloud Computing
18 20 (0.55%) Azure API Management
19 18 (0.50%) Amazon SageMaker
Communications & Networking
1 39 (1.07%) Wireless
2 29 (0.80%) TCP/IP
3 25 (0.69%) Network Security
4 24 (0.66%) Broadband
5 22 (0.61%) Software-Defined Radio
6 21 (0.58%) Modbus
7 17 (0.47%) WAN
8 14 (0.39%) MQTT
9 13 (0.36%) Firewall
9 13 (0.36%) Internet
10 12 (0.33%) 5G
10 12 (0.33%) Bluetooth
10 12 (0.33%) RS-232
10 12 (0.33%) SD-WAN
11 10 (0.28%) Ethernet
12 8 (0.22%) DNS
12 8 (0.22%) Wi-Fi
12 8 (0.22%) ZigBee
13 7 (0.19%) Profibus
13 7 (0.19%) RS-485
Database & Business Intelligence
1 368 (10.13%) SQL Server
2 99 (2.72%) NoSQL
3 91 (2.50%) MySQL
4 88 (2.42%) MongoDB
5 82 (2.26%) PostgreSQL
6 76 (2.09%) Relational Database
7 67 (1.84%) Elasticsearch
8 64 (1.76%) Big Data
9 32 (0.88%) Power BI
10 27 (0.74%) BigQuery
11 22 (0.61%) Data Warehouse
12 20 (0.55%) Azure SQL Database
13 19 (0.52%) Amazon RDS
13 19 (0.52%) DynamoDB
13 19 (0.52%) RDBMS
14 16 (0.44%) Amazon Redshift
15 14 (0.39%) Amazon Athena
15 14 (0.39%) Cloud Spanner
15 14 (0.39%) Redis
16 12 (0.33%) Apache Cassandra
Development Applications
1 348 (9.58%) JIRA
2 301 (8.28%) GitLab
3 277 (7.62%) Selenium
4 275 (7.57%) Bitbucket
5 270 (7.43%) SonarQube
6 263 (7.24%) Maven
7 262 (7.21%) Cucumber
8 260 (7.15%) Sonatype Nexus
9 227 (6.25%) Git
10 74 (2.04%) Jenkins
11 43 (1.18%) Visual Studio
12 28 (0.77%) Eclipse
13 27 (0.74%) JUnit
14 26 (0.72%) Rational DOORS
15 25 (0.69%) Cypress.io
15 25 (0.69%) Eclipse RCP
16 20 (0.55%) webpack
17 16 (0.44%) Atlassian Bamboo
18 15 (0.41%) Subversion
19 9 (0.25%) Oracle Forms
General
1 808 (22.23%) Finance
2 635 (17.47%) Inclusion and Diversity
3 544 (14.97%) Banking
4 446 (12.27%) Social Skills
5 331 (9.11%) Electronics
6 217 (5.97%) Analytical Skills
7 174 (4.79%) Law
8 167 (4.60%) Retail
9 146 (4.02%) Aerospace
10 131 (3.60%) Automotive
11 101 (2.78%) Investment Banking
12 95 (2.61%) Marketing
13 90 (2.48%) Corporate Banking
14 80 (2.20%) Manufacturing
15 76 (2.09%) Games
16 63 (1.73%) Public Sector
17 29 (0.80%) Military
18 28 (0.77%) Organisational Skills
19 26 (0.72%) Telecoms
20 24 (0.66%) Tech for Good
Job Titles
1 1,678 (46.18%) Software Engineer
2 763 (21.00%) Senior
3 551 (15.16%) Senior Software Engineer
4 518 (14.25%) Systems Engineer
5 397 (10.92%) Principal Engineer
6 362 (9.96%) Lead
7 289 (7.95%) Developer
8 184 (5.06%) Software Assurance Engineer
9 131 (3.60%) Lead Software Engineer
10 128 (3.52%) Principal Software Engineer
11 119 (3.27%) Embedded Engineer
12 117 (3.22%) Java Engineer
13 113 (3.11%) Software Developer
14 110 (3.03%) Embedded Software Engineer
15 108 (2.97%) Java Software Engineer
16 102 (2.81%) Engineering Manager
17 81 (2.23%) Software Manager
18 78 (2.15%) Full-Stack Engineer
19 70 (1.93%) Full-Stack Software Engineer
20 69 (1.90%) Team Leader
Libraries, Frameworks & Software Standards
1 608 (16.73%) React
2 520 (14.31%) .NET
3 432 (11.89%) HTML
4 417 (11.47%) Spring
5 393 (10.81%) Spring Boot
6 392 (10.79%) CSS
7 384 (10.57%) Node.js
8 382 (10.51%) Kafka
9 269 (7.40%) Redux
10 253 (6.96%) JPA
11 187 (5.15%) Hibernate
11 187 (5.15%) RESTful
12 175 (4.82%) REST
13 150 (4.13%) AngularJS
14 125 (3.44%) Jest
15 115 (3.16%) HTML5
16 108 (2.97%) CSS3
17 97 (2.67%) Sass
18 93 (2.56%) .NET Core
19 60 (1.65%) Software Packaging
Miscellaneous
1 368 (10.13%) Product Ownership
2 268 (7.37%) Enterprise Software
3 254 (6.99%) Cyberattack
4 208 (5.72%) Self-Motivation
5 198 (5.45%) Algorithms
6 172 (4.73%) Linux Command Line
7 108 (2.97%) Cloud Native
8 94 (2.59%) Embedded Systems
9 86 (2.37%) Management Information System
10 72 (1.98%) Distributed Systems
11 65 (1.79%) Public Cloud
12 60 (1.65%) Greenfield Project
12 60 (1.65%) Mobile App
13 44 (1.21%) Data Structures
14 42 (1.16%) Private Cloud
14 42 (1.16%) Robotics
15 38 (1.05%) IoT
15 38 (1.05%) Renewable Energy
16 28 (0.77%) Reference Data
17 25 (0.69%) e-Learning
Operating Systems
1 433 (11.92%) Linux
2 105 (2.89%) Windows
3 69 (1.90%) Android
4 45 (1.24%) Unix
5 36 (0.99%) Apple iOS
6 32 (0.88%) Embedded Linux
7 10 (0.28%) FreeRTOS
8 7 (0.19%) zOS
9 5 (0.14%) Mac OS
9 5 (0.14%) Red Hat Enterprise Linux
9 5 (0.14%) Robot Operating System
9 5 (0.14%) Windows Server
10 3 (0.083%) Ubuntu
11 2 (0.055%) Rocky
11 2 (0.055%) VMS
11 2 (0.055%) VxWorks
12 1 (0.028%) Debian
12 1 (0.028%) SafeRTOS
12 1 (0.028%) Solaris
12 1 (0.028%) ThreadX
Processes & Methodologies
1 1,666 (45.84%) Agile
2 841 (23.14%) Systems Engineering
3 799 (21.99%) CI/CD
4 776 (21.35%) Mathematics
5 732 (20.14%) Microservices
6 672 (18.49%) Validation
7 640 (17.61%) DevOps
8 637 (17.53%) SDLC
9 636 (17.50%) Mentoring
10 522 (14.36%) Full-Stack Development
11 506 (13.92%) SysML
12 499 (13.73%) Test Automation
13 497 (13.68%) Verification and Validation
14 491 (13.51%) Computer Science
15 489 (13.46%) Model-Based Systems Engineering
16 488 (13.43%) Problem-Solving
17 473 (13.02%) Digital Twin
18 409 (11.25%) Containerisation
19 371 (10.21%) Machine Learning
20 368 (10.13%) User Experience
Programming Languages
1 1,104 (30.38%) Java
2 920 (25.32%) JavaScript
3 763 (21.00%) Python
4 674 (18.55%) SQL
5 605 (16.65%) MATLAB
6 511 (14.06%) C#
7 501 (13.79%) C++
8 363 (9.99%) TypeScript
9 287 (7.90%) Rust
10 280 (7.71%) Go
11 269 (7.40%) C
12 159 (4.38%) Ada
13 82 (2.26%) PHP
14 46 (1.27%) Ada 95
15 30 (0.83%) Bash
16 24 (0.66%) Embedded C
17 23 (0.63%) Ruby
18 21 (0.58%) PowerShell
19 17 (0.47%) PL/SQL
20 16 (0.44%) VB
Qualifications
1 1,322 (36.38%) Degree
2 627 (17.25%) BPSS Clearance
3 510 (14.03%) HND
4 478 (13.15%) HNC
5 400 (11.01%) Security Cleared
6 272 (7.48%) DV Cleared
7 185 (5.09%) AWS Certification
8 177 (4.87%) AWS Certified Solutions Architect
9 175 (4.82%) AWS Certified Developer
10 167 (4.60%) Computer Science Degree
11 113 (3.11%) Chartered Engineer
12 103 (2.83%) SC Cleared
13 55 (1.51%) Master's Degree
14 30 (0.83%) PhD
15 20 (0.55%) Azure Certification
16 13 (0.36%) Numerate Degree
17 7 (0.19%) DBS Check
17 7 (0.19%) ISTQB
18 4 (0.11%) TOGAF Certification
19 3 (0.083%) PMP
Quality Assurance & Compliance
1 348 (9.58%) QA
2 126 (3.47%) Accessibility
3 78 (2.15%) ISO/IEC 12207
4 29 (0.80%) ISO/IEC 27001
5 24 (0.66%) Data Quality
6 12 (0.33%) GDPR
6 12 (0.33%) PMO
7 9 (0.25%) NIST
8 7 (0.19%) IEC 61131
8 7 (0.19%) SOC 2
9 6 (0.17%) California Consumer Privacy Act
9 6 (0.17%) Cyber Essentials
9 6 (0.17%) Cyber Essentials PLUS
9 6 (0.17%) IEC 61508
9 6 (0.17%) NCSC
9 6 (0.17%) Sarbanes-Oxley
10 5 (0.14%) NIST 800
10 5 (0.14%) PCI DSS
11 4 (0.11%) Def Stans
11 4 (0.11%) JSP 440
System Software
1 545 (15.00%) Docker
2 65 (1.79%) Firmware
3 38 (1.05%) Embedded Firmware
4 15 (0.41%) Virtual Machines
5 10 (0.28%) VMware Infrastructure
6 3 (0.083%) HDFS
7 1 (0.028%) Active Directory
7 1 (0.028%) Apache Flume
7 1 (0.028%) NDS
Systems Management
1 580 (15.96%) Kubernetes
2 175 (4.82%) Terraform
3 73 (2.01%) Ansible
4 30 (0.83%) Grafana
5 18 (0.50%) Prometheus
6 9 (0.25%) Istio
6 9 (0.25%) Kibana
7 6 (0.17%) ArcSight ESM
7 6 (0.17%) QRadar
7 6 (0.17%) Single Sign-On
8 3 (0.083%) Argo
8 3 (0.083%) BMC PATROL
9 2 (0.055%) Graylog
9 2 (0.055%) ITRS Geneos
9 2 (0.055%) Netcool
9 2 (0.055%) Netcool/OMNIbus
9 2 (0.055%) Podman
9 2 (0.055%) Progress Chef
9 2 (0.055%) Puppet
9 2 (0.055%) Tivoli
Vendors
1 246 (6.77%) Solace
2 129 (3.55%) Microsoft
3 99 (2.72%) Siemens
4 93 (2.56%) Oracle
5 92 (2.53%) Google
6 68 (1.87%) Databricks
7 36 (0.99%) PayPal
8 30 (0.83%) ServiceNow
9 24 (0.66%) Atlassian
10 23 (0.63%) Splunk
11 19 (0.52%) IBM
12 15 (0.41%) Ping Identity
13 13 (0.36%) Dynatrace
13 13 (0.36%) SAP
14 11 (0.30%) Adobe
15 10 (0.28%) Red Hat
15 10 (0.28%) Sybase
15 10 (0.28%) VMware
16 8 (0.22%) Facebook
16 8 (0.22%) Salesforce