Public Cloud Jobs in the UK excluding London

Public Cloud
UK > UK excluding London

The table below looks at the prevalence of the term Public Cloud in permanent job vacancies in the UK excluding London. Included is a benchmarking guide to the salaries offered in vacancies that cited Public Cloud over the 6 months leading up to 12 May 2025, comparing them to the same period in the previous two years.

6 months to
12 May 2025
Same period 2024 Same period 2023
Rank 394 192 97
Rank change year-on-year -202 -95 +181
Permanent jobs citing Public Cloud 198 1,050 2,007
As % of all permanent jobs advertised in the UK excluding London 0.51% 1.48% 3.35%
As % of the Miscellaneous category 1.55% 4.35% 7.92%
Number of salaries quoted 128 552 607
10th Percentile £47,125 £42,238 £41,250
25th Percentile £57,688 £53,438 £50,015
Median annual salary (50th Percentile) £74,870 £62,783 £66,000
Median % change year-on-year +19.25% -4.88% +7.88%
75th Percentile £93,778 £81,786 £87,419
90th Percentile £100,750 £90,000 £115,000
UK median annual salary £76,500 £65,058 £73,750
% change year-on-year +17.59% -11.79% -1.67%

All Generic Skills
UK excluding London

Public Cloud falls under the General and Transferable Skills category. For comparison with the information above, the following table provides summary statistics for all permanent job vacancies requiring generic IT skills in the UK excluding London.

Permanent vacancies with a requirement for generic IT skills 12,770 24,143 25,352
As % of all permanent jobs advertised in the UK excluding London 32.58% 34.01% 42.34%
Number of salaries quoted 6,172 15,240 11,276
10th Percentile £29,000 £26,250 £31,250
25th Percentile £37,500 £35,000 £40,000
Median annual salary (50th Percentile) £55,000 £50,000 £55,000
Median % change year-on-year +10.00% -9.09% +4.76%
75th Percentile £68,000 £65,000 £70,000
90th Percentile £78,975 £80,000 £85,000
UK median annual salary £60,000 £55,000 £65,000
% change year-on-year +9.09% -15.38% +4.00%

Public Cloud
Job Vacancy Trend in the UK excluding London

Job postings citing Public Cloud as a proportion of all IT jobs advertised in the UK excluding London.
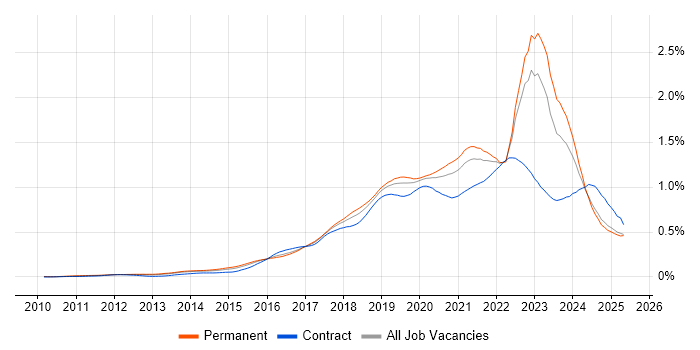
Job vacancy trend for Public Cloud in the UK excluding London

Public Cloud
Salary Trend in the UK excluding London

3-month moving average salary quoted in jobs citing Public Cloud in the UK excluding London.

Salary trend for Public Cloud in the UK excluding London

Public Cloud
Salary Histogram in the UK excluding London

Salary distribution for jobs citing Public Cloud in the UK excluding London over the 6 months to 12 May 2025.

Salary histogram for Public Cloud in the UK excluding London

Public Cloud
Job Locations in the UK excluding London

The table below looks at the demand and provides a guide to the median salaries quoted in IT jobs citing Public Cloud within the UK excluding London region over the 6 months to 12 May 2025. The 'Rank Change' column provides an indication of the change in demand within each location based on the same 6 month period last year.

Location Rank Change
on Same Period
Last Year
Matching
Permanent
IT Job Ads
Median Salary
Past 6 Months
Median Salary
% Change
on Same Period
Last Year
Live
Jobs
North of England -124 70 £71,991 +14.67% 72
North West -118 40 £74,935 +19.36% 44
Scotland -65 36 £85,253 +36.40% 28
South East +63 33 £55,000 -15.38% 78
South West +31 25 £94,637 +34.09% 18
Yorkshire -20 25 £63,139 +0.57% 19
Midlands -9 16 £70,000 +14.37% 34
West Midlands +11 13 £70,000 +14.37% 25
East of England +34 11 £62,500 +25.00% 13
North East +17 5 £60,000 -4.43% 10
Northern Ireland +29 3 - - 7
Wales +24 3 £69,000 -2.23% 8
East Midlands +13 3 £68,525 +14.21% 7
Isle of Man - 1 £50,000 -
Public Cloud
UK

Public Cloud
Co-occurring Skills and Capabilities in the UK excluding London by Category

The follow tables expand on the table above by listing co-occurrences grouped by category. The same employment type, locality and period is covered with up to 20 co-occurrences shown in each of the following categories:

Application Platforms
1 7 (3.54%) Microsoft Exchange
2 3 (1.52%) Apache
2 3 (1.52%) Confluence
2 3 (1.52%) OpenStack
3 2 (1.01%) Apache Spark
3 2 (1.01%) IIS
4 1 (0.51%) nginx
4 1 (0.51%) SharePoint
4 1 (0.51%) Tomcat
Applications
1 4 (2.02%) Microsoft Office
2 2 (1.01%) MS Visio
3 1 (0.51%) AutoCAD
3 1 (0.51%) Microsoft Excel
3 1 (0.51%) Microsoft PowerPoint
3 1 (0.51%) Microsoft Project
Business Applications
1 2 (1.01%) SAP S/4HANA
2 1 (0.51%) Cloudability
2 1 (0.51%) Oracle Applications
2 1 (0.51%) SAP CO
2 1 (0.51%) SAP FI
2 1 (0.51%) SAP PS
2 1 (0.51%) Sparx Enterprise Architect
Cloud Services
1 106 (53.54%) Azure
2 79 (39.90%) AWS
3 74 (37.37%) GCP
4 21 (10.61%) PaaS
5 20 (10.10%) SaaS
6 15 (7.58%) Microsoft 365
7 14 (7.07%) IaaS
8 11 (5.56%) GitHub
9 10 (5.05%) Azure DevOps
9 10 (5.05%) Azure Machine Learning
10 8 (4.04%) npm
10 8 (4.04%) Serverless
11 6 (3.03%) AWS Lambda
11 6 (3.03%) GitHub Actions
12 5 (2.53%) Entra ID
13 4 (2.02%) Adobe Analytics
13 4 (2.02%) Google Analytics
14 3 (1.52%) Amazon EKS
14 3 (1.52%) Nutanix
15 2 (1.01%) Amazon ECS
Communications & Networking
1 13 (6.57%) Firewall
2 11 (5.56%) WAN
3 10 (5.05%) Wireless
4 9 (4.55%) SD-WAN
4 9 (4.55%) TCP/IP
5 8 (4.04%) OSPF
6 7 (3.54%) BGP
6 7 (3.54%) MPLS
7 6 (3.03%) LAN
7 6 (3.03%) NetScaler
7 6 (3.03%) VPN
8 5 (2.53%) Network Security
9 4 (2.02%) DNS
9 4 (2.02%) IPv4
10 3 (1.52%) Ethernet
10 3 (1.52%) SAN
10 3 (1.52%) Wi-Fi
11 2 (1.01%) Fibre Channel
11 2 (1.01%) Structured Cabling
11 2 (1.01%) VLAN
Database & Business Intelligence
1 12 (6.06%) Big Data
2 11 (5.56%) Cloud Spanner
2 11 (5.56%) SQL Server
3 10 (5.05%) Data Lake
3 10 (5.05%) MongoDB
4 7 (3.54%) NoSQL
4 7 (3.54%) RDBMS
4 7 (3.54%) Relational Database
5 4 (2.02%) Tableau
6 3 (1.52%) BigQuery
7 2 (1.01%) Apache Hive
7 2 (1.01%) Azure SQL Database
7 2 (1.01%) Bigtable
7 2 (1.01%) DynamoDB
7 2 (1.01%) Hadoop
7 2 (1.01%) HBase
7 2 (1.01%) Impala
7 2 (1.01%) Metadata
7 2 (1.01%) PostgreSQL
7 2 (1.01%) Power BI
Development Applications
1 24 (12.12%) Jenkins
2 20 (10.10%) Git
3 13 (6.57%) JIRA
4 12 (6.06%) webpack
5 8 (4.04%) Cypress.io
5 8 (4.04%) Sonatype Nexus
6 7 (3.54%) Cucumber
7 6 (3.03%) CircleCI
7 6 (3.03%) Visual Studio
8 5 (2.53%) IBM UrbanCode
9 4 (2.02%) GitLab
10 1 (0.51%) Bitbucket
10 1 (0.51%) SonarQube
General
1 80 (40.40%) Finance
2 70 (35.35%) Banking
3 46 (23.23%) Social Skills
4 25 (12.63%) Analytical Skills
5 23 (11.62%) Public Sector
6 17 (8.59%) Law
7 13 (6.57%) Telecoms
8 8 (4.04%) Retail
9 7 (3.54%) Organisational Skills
10 5 (2.53%) Inclusion and Diversity
11 2 (1.01%) Billing
11 2 (1.01%) Electronics
11 2 (1.01%) Influencing Skills
11 2 (1.01%) Welsh Language
12 1 (0.51%) Automotive
12 1 (0.51%) General Ledger
12 1 (0.51%) Legal
12 1 (0.51%) Manufacturing
12 1 (0.51%) Marketing
Job Titles
1 64 (32.32%) Senior
2 50 (25.25%) Software Engineer
3 31 (15.66%) Architect
4 30 (15.15%) Lead
5 23 (11.62%) Cloud Engineer
6 17 (8.59%) Senior Software Engineer
7 15 (7.58%) Senior Architect
8 13 (6.57%) Senior Cloud Engineer
8 13 (6.57%) Solutions Architect
9 9 (4.55%) Data Architect
9 9 (4.55%) Infrastructure Engineer
10 8 (4.04%) Java Engineer
10 8 (4.04%) Security Engineer
10 8 (4.04%) Senior Solutions Architect
10 8 (4.04%) Technical Engineer
11 7 (3.54%) Cloud Security Engineer
11 7 (3.54%) DevOps Engineer
11 7 (3.54%) Domain Architect
11 7 (3.54%) Lead Java Engineer
11 7 (3.54%) Senior Data Architect
Libraries, Frameworks & Software Standards
1 24 (12.12%) Spring Boot
2 21 (10.61%) Node.js
2 21 (10.61%) RESTful
3 19 (9.60%) React
4 14 (7.07%) .NET
5 13 (6.57%) Kafka
6 12 (6.06%) Jest
7 10 (5.05%) gRPC
7 10 (5.05%) REST
8 9 (4.55%) Web Services
9 8 (4.04%) AngularJS
10 7 (3.54%) Middleware
11 6 (3.03%) ASP.NET
11 6 (3.03%) ASP.NET MVC
11 6 (3.03%) CSS
11 6 (3.03%) HTML
11 6 (3.03%) Spring
12 5 (2.53%) .NET Core
12 5 (2.53%) Redux
13 4 (2.02%) Enzyme
Miscellaneous
1 31 (15.66%) Cloud Native
2 24 (12.12%) Distributed Systems
3 21 (10.61%) Data Centre
4 18 (9.09%) Algorithms
5 17 (8.59%) Data Structures
6 15 (7.58%) Private Cloud
7 14 (7.07%) Product Ownership
8 13 (6.57%) Hybrid Cloud
9 10 (5.05%) Reference Data
9 10 (5.05%) Replication
10 9 (4.55%) Management Information System
10 9 (4.55%) Security Posture
11 8 (4.04%) Distributed Architecture
11 8 (4.04%) Legacy Systems
12 7 (3.54%) Distributed Applications
13 6 (3.03%) Greenfield Project
13 6 (3.03%) Tandem
14 5 (2.53%) Driving Licence
14 5 (2.53%) Mainframe
15 4 (2.02%) Enterprise Software
Operating Systems
1 32 (16.16%) Linux
2 25 (12.63%) Windows
3 7 (3.54%) Red Hat Enterprise Linux
4 5 (2.53%) Unix
4 5 (2.53%) Windows Server
5 3 (1.52%) Debian
5 3 (1.52%) Ubuntu
5 3 (1.52%) Windows Server 2016
6 2 (1.01%) VMS
6 2 (1.01%) Windows Server 2012
6 2 (1.01%) Windows Server 2019
7 1 (0.51%) CentOS
7 1 (0.51%) Mac OS
Processes & Methodologies
1 75 (37.88%) CI/CD
2 63 (31.82%) DevOps
2 63 (31.82%) Software Engineering
3 52 (26.26%) Agile
4 48 (24.24%) Mentoring
5 47 (23.74%) Roadmaps
5 47 (23.74%) Test Automation
6 46 (23.23%) Infrastructure as Code
7 42 (21.21%) Coaching
8 41 (20.71%) Microservices
9 34 (17.17%) Analytics
10 31 (15.66%) Problem-Solving
11 25 (12.63%) Continuous Integration
12 24 (12.12%) Cloud Security
13 23 (11.62%) High Availability
14 22 (11.11%) Containerisation
14 22 (11.11%) SDLC
15 21 (10.61%) Machine Learning
16 20 (10.10%) Full-Stack Development
16 20 (10.10%) Infrastructure Engineering
Programming Languages
1 47 (23.74%) Java
2 32 (16.16%) Python
3 30 (15.15%) SQL
4 29 (14.65%) JavaScript
5 21 (10.61%) C#
6 20 (10.10%) PowerShell
7 13 (6.57%) Bash
7 13 (6.57%) TypeScript
8 7 (3.54%) Scala
9 6 (3.03%) Clojure
9 6 (3.03%) Elixir
9 6 (3.03%) Go
9 6 (3.03%) Rust
10 5 (2.53%) JCL
10 5 (2.53%) Shell Script
11 4 (2.02%) R
12 2 (1.01%) Ruby
13 1 (0.51%) PHP
13 1 (0.51%) VB
13 1 (0.51%) VBA
Qualifications
1 25 (12.63%) Degree
2 9 (4.55%) AWS Certification
3 8 (4.04%) Security Cleared
4 7 (3.54%) SC Cleared
5 6 (3.03%) Azure Certification
5 6 (3.03%) Numerate Degree
6 3 (1.52%) Cisco Certification
7 2 (1.01%) CCNA
7 2 (1.01%) CCNP
7 2 (1.01%) DBS Check
7 2 (1.01%) Master's Degree
7 2 (1.01%) Microsoft Certification
7 2 (1.01%) TOGAF Certification
8 1 (0.51%) AWS Certified Cloud Practitioner
8 1 (0.51%) CCA
8 1 (0.51%) DV Cleared
Quality Assurance & Compliance
1 8 (4.04%) Accessibility
2 4 (2.02%) ISO/IEC 27001
3 2 (1.01%) Data Quality
4 1 (0.51%) Cyber Essentials
4 1 (0.51%) Cyber Essentials PLUS
4 1 (0.51%) NIST
4 1 (0.51%) SLA
System Software
1 24 (12.12%) Docker
2 12 (6.06%) Active Directory
2 12 (6.06%) Virtual Machines
3 10 (5.05%) VMware Infrastructure
4 8 (4.04%) Hyper-V
5 2 (1.01%) HDFS
5 2 (1.01%) vSphere
6 1 (0.51%) VMware ESXi
Systems Management
1 67 (33.84%) Kubernetes
2 44 (22.22%) Terraform
3 16 (8.08%) Ansible
4 7 (3.54%) FortiGate
4 7 (3.54%) Microsoft Intune
5 5 (2.53%) CA Endevor
5 5 (2.53%) Puppet
5 5 (2.53%) WSUS
6 3 (1.52%) Grafana
6 3 (1.52%) Prometheus
7 2 (1.01%) Hadoop YARN
7 2 (1.01%) Istio
7 2 (1.01%) NetBackup
7 2 (1.01%) vCenter Server
8 1 (0.51%) Argo
8 1 (0.51%) Failover Clustering
8 1 (0.51%) Nagios
8 1 (0.51%) Nessus
Vendors
1 43 (21.72%) Microsoft
2 27 (13.64%) Google
3 16 (8.08%) VMware
4 7 (3.54%) Cisco
4 7 (3.54%) Citrix
5 5 (2.53%) Draytek
5 5 (2.53%) Ubiquiti
6 4 (2.02%) Adobe
6 4 (2.02%) Tealium
7 3 (1.52%) F5
7 3 (1.52%) Fortinet
7 3 (1.52%) Red Hat
7 3 (1.52%) SAP
8 2 (1.01%) Cloudera
8 2 (1.01%) Dynatrace
8 2 (1.01%) Fiserv
8 2 (1.01%) MapR
8 2 (1.01%) Mitel
8 2 (1.01%) TSYS
8 2 (1.01%) Zerto