Disaster Recovery Jobs in the UK excluding London

Disaster Recovery
UK > UK excluding London

The table below provides summary statistics for permanent job vacancies advertised in the UK excluding London requiring Disaster Recovery skills. It includes a benchmarking guide to the annual salaries offered in vacancies that cited Disaster Recovery over the 6 months leading up to 13 June 2025, comparing them to the same period in the previous two years.

6 months to
13 Jun 2025
Same period 2024 Same period 2023
Rank 310 218 262
Rank change year-on-year -92 +44 +18
Permanent jobs citing Disaster Recovery 323 966 721
As % of all permanent jobs advertised in the UK excluding London 0.82% 1.21% 1.30%
As % of the Processes & Methodologies category 0.89% 1.49% 1.37%
Number of salaries quoted 269 778 487
10th Percentile £32,000 £31,250 £32,200
25th Percentile £40,000 £39,720 £38,356
Median annual salary (50th Percentile) £55,000 £50,000 £50,000
Median % change year-on-year +10.00% - +5.26%
75th Percentile £67,500 £61,250 £63,750
90th Percentile £77,500 £70,000 £75,000
UK median annual salary £62,500 £55,000 £57,500
% change year-on-year +13.64% -4.35% +4.55%

All Process and Methodology Skills
UK excluding London

Disaster Recovery falls under the Processes and Methodologies category. For comparison with the information above, the following table provides summary statistics for all permanent job vacancies requiring process or methodology skills in the UK excluding London.

Permanent vacancies with a requirement for process or methodology skills 36,204 64,705 52,764
As % of all permanent jobs advertised in the UK excluding London 91.36% 80.78% 95.49%
Number of salaries quoted 17,609 43,767 28,368
10th Percentile £26,000 £27,500 £30,500
25th Percentile £35,000 £36,250 £40,000
Median annual salary (50th Percentile) £50,055 £50,000 £55,000
Median % change year-on-year +0.11% -9.09% +4.76%
75th Percentile £65,000 £65,000 £70,000
90th Percentile £77,500 £77,500 £82,500
UK median annual salary £56,000 £55,000 £60,899
% change year-on-year +1.82% -9.69% +1.50%

Disaster Recovery
Job Vacancy Trend in the UK excluding London

Job postings citing Disaster Recovery as a proportion of all IT jobs advertised in the UK excluding London.
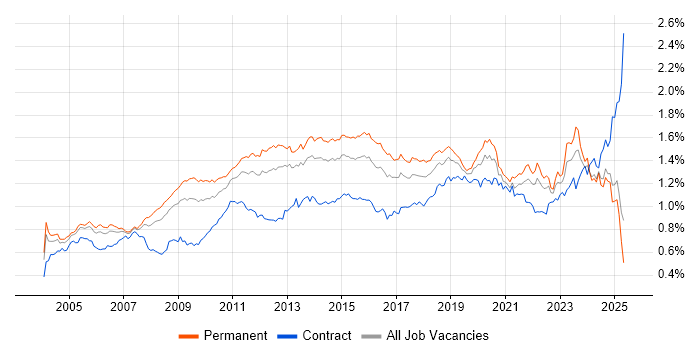
Job vacancy trend for Disaster Recovery in the UK excluding London

Disaster Recovery
Salary Trend in the UK excluding London

3-month moving average salary quoted in jobs citing Disaster Recovery in the UK excluding London.

Salary trend for Disaster Recovery in the UK excluding London

Disaster Recovery
Salary Histogram in the UK excluding London

Salary distribution for jobs citing Disaster Recovery in the UK excluding London over the 6 months to 13 June 2025.

Salary histogram for Disaster Recovery in the UK excluding London

Disaster Recovery
Job Locations in the UK excluding London

The table below looks at the demand and provides a guide to the median salaries quoted in IT jobs citing Disaster Recovery within the UK excluding London region over the 6 months to 13 June 2025. The 'Rank Change' column provides an indication of the change in demand within each location based on the same 6 month period last year.

Location Rank Change
on Same Period
Last Year
Matching
Permanent
IT Job Ads
Median Salary
Past 6 Months
Median Salary
% Change
on Same Period
Last Year
Live
Jobs
South East +19 93 £55,000 -4.35% 161
North of England -94 83 £55,000 +19.57% 105
South West +111 64 £55,000 +1.77% 28
North West -111 40 £55,000 +19.57% 68
Midlands -80 37 £48,000 +3.23% 87
East of England -14 33 £53,000 +6.00% 69
Yorkshire +22 25 £62,500 +25.00% 22
West Midlands -45 19 £57,500 +9.52% 48
North East +23 18 £50,000 +11.11% 15
East Midlands -25 17 £40,000 -5.88% 36
Scotland +60 11 £55,000 +10.00% 48
Northern Ireland +39 1 £57,500 +37.72% 6
Wales +15 1 £50,000 +53.85% 20
Isle of Man - 1 £34,500 -
Disaster Recovery
UK

Disaster Recovery
Co-occurring Skills and Capabilities in the UK excluding London by Category

The follow tables expand on the table above by listing co-occurrences grouped by category. The same employment type, locality and period is covered with up to 20 co-occurrences shown in each of the following categories:

Application Platforms
1 45 (13.93%) Microsoft Exchange
2 25 (7.74%) SharePoint
3 13 (4.02%) IIS
4 3 (0.93%) Apache
4 3 (0.93%) Skype for Business
5 2 (0.62%) Apache Spark
6 1 (0.31%) BizTalk Server
6 1 (0.31%) Cloud Foundry
6 1 (0.31%) Confluence
6 1 (0.31%) Exchange Server 2013
6 1 (0.31%) nginx
6 1 (0.31%) Office Communications Server
6 1 (0.31%) OpenStack
6 1 (0.31%) SharePoint 2010
6 1 (0.31%) SharePoint Server
6 1 (0.31%) Tomcat
6 1 (0.31%) WordPress
Applications
1 9 (2.79%) Microsoft Office
2 2 (0.62%) Microsoft Excel
2 2 (0.62%) Spreadsheet
3 1 (0.31%) Microsoft PowerPoint
Business Applications
1 2 (0.62%) SAP GRC
1 2 (0.62%) SAP S/4HANA
2 1 (0.31%) Dynamics CRM
2 1 (0.31%) Payment Gateway
2 1 (0.31%) Sage 200
Cloud Services
1 160 (49.54%) Azure
2 87 (26.93%) Microsoft 365
3 70 (21.67%) AWS
4 29 (8.98%) Entra ID
5 20 (6.19%) GCP
6 19 (5.88%) Azure DevOps
7 15 (4.64%) GitHub
8 14 (4.33%) IaaS
9 13 (4.02%) PaaS
10 10 (3.10%) Azure Key Vault
11 9 (2.79%) Rubrik
12 8 (2.48%) Azure Monitor
12 8 (2.48%) SaaS
13 7 (2.17%) Nutanix
13 7 (2.17%) Power Platform
14 6 (1.86%) OneDrive
14 6 (1.86%) Serverless
15 5 (1.55%) Amazon EC2
15 5 (1.55%) Azure Functions
15 5 (1.55%) Azure Logic Apps
Communications & Networking
1 87 (26.93%) Firewall
2 68 (21.05%) DNS
3 61 (18.89%) VPN
4 59 (18.27%) DHCP
5 43 (13.31%) VLAN
6 32 (9.91%) SAN
7 30 (9.29%) Network Security
8 29 (8.98%) NAS
9 28 (8.67%) WAN
10 23 (7.12%) LAN
11 19 (5.88%) TCP/IP
12 18 (5.57%) VoIP
13 17 (5.26%) Intrusion Detection
14 13 (4.02%) SD-WAN
15 10 (3.10%) ADSL
16 7 (2.17%) VSAN
17 6 (1.86%) BGP
17 6 (1.86%) MPLS
17 6 (1.86%) Unified Communications
17 6 (1.86%) Wireless
Database & Business Intelligence
1 45 (13.93%) SQL Server
2 21 (6.50%) Amazon RDS
3 13 (4.02%) PostgreSQL
4 12 (3.72%) MySQL
5 11 (3.41%) SQL Server Integration Services
6 10 (3.10%) Azure SQL Database
7 8 (2.48%) MongoDB
7 8 (2.48%) NoSQL
8 5 (1.55%) Data Warehouse
8 5 (1.55%) Power BI
9 3 (0.93%) RDBMS
9 3 (0.93%) Relational Database
9 3 (0.93%) SQL Server Analysis Services
9 3 (0.93%) SQL Server Reporting Services
9 3 (0.93%) Tableau
10 2 (0.62%) Big Data
10 2 (0.62%) Bigtable
10 2 (0.62%) Elasticsearch
10 2 (0.62%) Hadoop
10 2 (0.62%) SAP HANA
Development Applications
1 8 (2.48%) Jenkins
2 5 (1.55%) Git
2 5 (1.55%) Oracle Forms
3 4 (1.24%) GitLab
4 3 (0.93%) Bitbucket
4 3 (0.93%) JIRA
4 3 (0.93%) Octopus Deploy
5 1 (0.31%) Jaeger
5 1 (0.31%) Maven
5 1 (0.31%) MSBuild
5 1 (0.31%) SQL Server Management Studio (SSMS)
5 1 (0.31%) Subversion
General
1 111 (34.37%) Social Skills
2 45 (13.93%) Finance
3 22 (6.81%) Manufacturing
4 20 (6.19%) Analytical Skills
5 15 (4.64%) Law
6 11 (3.41%) Banking
6 11 (3.41%) Telecoms
7 8 (2.48%) Public Sector
8 7 (2.17%) Games
8 7 (2.17%) Inclusion and Diversity
8 7 (2.17%) Legal
8 7 (2.17%) Pharmaceutical
9 6 (1.86%) Retail
9 6 (1.86%) Tech for Good
10 5 (1.55%) Marketing
11 3 (0.93%) Advertising
11 3 (0.93%) Electronics
12 2 (0.62%) Aerospace
13 1 (0.31%) Military
13 1 (0.31%) Presentation Skills
Job Titles
1 56 (17.34%) Infrastructure Engineer
2 50 (15.48%) Analyst
3 38 (11.76%) IT Support
4 37 (11.46%) Senior
5 35 (10.84%) IT Engineer
6 32 (9.91%) Support Engineer
7 31 (9.60%) IT Analyst
8 26 (8.05%) Cloud Engineer
9 23 (7.12%) IT Support Engineer
9 23 (7.12%) Lead
10 22 (6.81%) Infrastructure Support
10 22 (6.81%) Infrastructure Support Engineer
10 22 (6.81%) IT Infrastructure Engineer
11 21 (6.50%) Support Analyst
12 20 (6.19%) DBA
13 19 (5.88%) IT Manager
14 17 (5.26%) 2nd Line Support
14 17 (5.26%) SQL DBA
15 15 (4.64%) Administrator
15 15 (4.64%) IT Support Analyst
Libraries, Frameworks & Software Standards
1 10 (3.10%) Middleware
2 5 (1.55%) .NET
2 5 (1.55%) YAML
3 3 (0.93%) Elastic Stack
3 3 (0.93%) SAP Basis
4 2 (0.62%) FIDO
4 2 (0.62%) JWT
4 2 (0.62%) LDAP
4 2 (0.62%) OAuth
4 2 (0.62%) OAuth2
4 2 (0.62%) OpenID
4 2 (0.62%) RabbitMQ
4 2 (0.62%) RESTful
4 2 (0.62%) SAML
4 2 (0.62%) SAP Fiori
4 2 (0.62%) SOAP
5 1 (0.31%) HTML5
5 1 (0.31%) Kafka
5 1 (0.31%) Laravel
5 1 (0.31%) Memcached
Miscellaneous
1 21 (6.50%) Clustering
2 18 (5.57%) Cyber Threat
3 17 (5.26%) Management Information System
4 15 (4.64%) Data Centre
5 9 (2.79%) Cloud Native
5 9 (2.79%) Driving Licence
5 9 (2.79%) Security Posture
6 8 (2.48%) Hybrid Cloud
7 7 (2.17%) Operational Technology
7 7 (2.17%) Replication
8 6 (1.86%) Cyberattack
8 6 (1.86%) Data Protection Act
8 6 (1.86%) PKI
9 5 (1.55%) Blackberry
9 5 (1.55%) Public Cloud
10 4 (1.24%) Product Ownership
10 4 (1.24%) Self-Motivation
11 3 (0.93%) Analytical Mindset
11 3 (0.93%) CMDB
11 3 (0.93%) Onboarding
Operating Systems
1 132 (40.87%) Windows
2 89 (27.55%) Windows Server
3 65 (20.12%) Linux
4 12 (3.72%) Ubuntu
5 10 (3.10%) Windows Server 2012
6 9 (2.79%) CentOS
7 7 (2.17%) Rocky
8 6 (1.86%) Red Hat Enterprise Linux
8 6 (1.86%) Unix
8 6 (1.86%) Windows Server 2019
9 5 (1.55%) Debian
10 4 (1.24%) Windows Server 2016
11 3 (0.93%) VMS
12 2 (0.62%) AIX
12 2 (0.62%) Solaris
12 2 (0.62%) SUSE
13 1 (0.31%) Mac OS
13 1 (0.31%) Windows Server 2008
Processes & Methodologies
1 86 (26.63%) Business Continuity
2 72 (22.29%) High Availability
3 66 (20.43%) Infrastructure Engineering
4 65 (20.12%) Cybersecurity
5 61 (18.89%) Problem-Solving
6 53 (16.41%) Continuous Improvement
6 53 (16.41%) ITIL
7 41 (12.69%) DevOps
8 39 (12.07%) Mentoring
9 35 (10.84%) CI/CD
10 31 (9.60%) Service Delivery
11 28 (8.67%) Incident Management
12 27 (8.36%) IT Strategy
13 26 (8.05%) BCP
14 25 (7.74%) Data Protection
14 25 (7.74%) Migration
14 25 (7.74%) Project Delivery
15 24 (7.43%) Analytics
15 24 (7.43%) Patch Management
16 22 (6.81%) Project Management
Programming Languages
1 76 (23.53%) PowerShell
2 60 (18.58%) SQL
3 24 (7.43%) Python
4 15 (4.64%) T-SQL
5 13 (4.02%) Java
6 11 (3.41%) C#
7 9 (2.79%) Bash
8 5 (1.55%) Bicep
9 3 (0.93%) Perl
9 3 (0.93%) PHP
10 2 (0.62%) JavaScript
10 2 (0.62%) Ruby
10 2 (0.62%) Rust
11 1 (0.31%) Go
11 1 (0.31%) Kusto Query Language
11 1 (0.31%) PL/SQL
11 1 (0.31%) Shell Script
11 1 (0.31%) VB.NET
11 1 (0.31%) VBA
11 1 (0.31%) VBScript
Qualifications
1 38 (11.76%) Azure Certification
1 38 (11.76%) Security Cleared
2 36 (11.15%) Degree
3 30 (9.29%) Microsoft Certification
4 21 (6.50%) SC Cleared
5 20 (6.19%) DV Cleared
6 15 (4.64%) AWS Certification
6 15 (4.64%) Cisco Certification
7 13 (4.02%) CCNA
8 12 (3.72%) VMware Certified Professional (VCP)
9 11 (3.41%) HND
9 11 (3.41%) Network+ Certification
10 10 (3.10%) A+ Certification
11 8 (2.48%) Computer Science Degree
12 7 (2.17%) AWS Certified Solutions Architect
13 6 (1.86%) DBS Check
13 6 (1.86%) MCSE
14 5 (1.55%) CompTIA Security+
14 5 (1.55%) Master's Degree
14 5 (1.55%) MCSA
Quality Assurance & Compliance
1 47 (14.55%) GDPR
2 28 (8.67%) ISO/IEC 27001
3 21 (6.50%) NIST
4 16 (4.95%) Cyber Essentials
5 9 (2.79%) SLA
6 8 (2.48%) HIPAA
6 8 (2.48%) QA
7 7 (2.17%) PCI DSS
8 6 (1.86%) ISO/IEC 27002 (supersedes ISO/IEC 17799)
9 5 (1.55%) ISO 22301
10 4 (1.24%) Data Quality
11 3 (0.93%) Accessibility
12 2 (0.62%) Cyber Essentials PLUS
12 2 (0.62%) GRC
13 1 (0.31%) Actionable Recommendations
13 1 (0.31%) California Consumer Privacy Act
13 1 (0.31%) COBIT
System Software
1 102 (31.58%) Active Directory
2 69 (21.36%) VMware Infrastructure
3 44 (13.62%) Hyper-V
4 24 (7.43%) Virtual Machines
5 14 (4.33%) Docker
6 11 (3.41%) VMware ESXi
7 8 (2.48%) vSphere
8 7 (2.17%) Firmware
9 6 (1.86%) VMware NSX
10 2 (0.62%) HDFS
10 2 (0.62%) pfSense
10 2 (0.62%) Squid
10 2 (0.62%) Virtual Servers
10 2 (0.62%) VMware Workstation
11 1 (0.31%) ISA Server
11 1 (0.31%) KVM
11 1 (0.31%) NFS
11 1 (0.31%) vCloud
11 1 (0.31%) Veritas Cluster Server
Systems Management
1 32 (9.91%) Microsoft Intune
2 24 (7.43%) Terraform
3 19 (5.88%) Kubernetes
4 15 (4.64%) Ansible
5 9 (2.79%) NetBackup
5 9 (2.79%) Progress Chef
6 6 (1.86%) FortiGate
7 4 (1.24%) Single Sign-On
7 4 (1.24%) vCenter Server
8 3 (0.93%) Iperf
8 3 (0.93%) Puppet
9 2 (0.62%) Active Directory Federation Services
9 2 (0.62%) Grafana
9 2 (0.62%) Hadoop YARN
9 2 (0.62%) Kibana
9 2 (0.62%) PowerCLI
9 2 (0.62%) Prometheus
9 2 (0.62%) SCOM
9 2 (0.62%) vRealize
9 2 (0.62%) VxRail
Vendors
1 148 (45.82%) Microsoft
2 92 (28.48%) VMware
3 21 (6.50%) Cisco
4 20 (6.19%) Google
5 18 (5.57%) Veeam
6 11 (3.41%) Oracle
7 10 (3.10%) SAP
8 9 (2.79%) Commvault
9 7 (2.17%) Fortinet
9 7 (2.17%) Zerto
10 6 (1.86%) Dell
10 6 (1.86%) HP
10 6 (1.86%) Red Hat
10 6 (1.86%) ServiceNow
11 5 (1.55%) Atlassian
11 5 (1.55%) Databricks
11 5 (1.55%) McAfee
11 5 (1.55%) RedGate
11 5 (1.55%) Salesforce
12 4 (1.24%) Genesys