Failover Clustering Jobs with Hybrid/Remote/WFH Options

Failover Clustering (High-Availability, HA)
UK > Work from Home

The table below provides summary statistics for permanent remote or hybrid work requiring Failover Clustering skills. It includes a benchmarking guide to the annual salaries offered in vacancies that cited Failover Clustering over the 6 months leading up to 1 May 2025, comparing them to the same period in the previous two years.

6 months to
1 May 2025
Same period 2024 Same period 2023
Rank 382 583 644
Rank change year-on-year +201 +61 +161
Permanent jobs citing Failover Clustering 15 9 29
As % of all permanent jobs with a WFH option 0.10% 0.027% 0.068%
As % of the Systems Management category 0.87% 0.23% 0.43%
Number of salaries quoted 10 7 26
10th Percentile £52,500 - £38,356
25th Percentile £56,875 £50,000 £47,375
Median annual salary (50th Percentile) £70,000 £54,000 £56,250
Median % change year-on-year +29.63% -4.00% -6.25%
75th Percentile - - £69,063
90th Percentile - - £78,750
UK median annual salary £70,000 £42,500 £52,500
% change year-on-year +64.71% -19.05% -12.50%

All Systems Management Skills
Work from Home

Failover Clustering falls under the Systems Management category. For comparison with the information above, the following table provides summary statistics for all permanent job vacancies with remote or hybrid options requiring systems management skills.

Permanent vacancies with a requirement for systems management skills 1,724 3,942 6,814
As % of all permanent jobs with a WFH option 11.53% 11.65% 15.94%
Number of salaries quoted 1,340 3,002 4,816
10th Percentile £41,225 £37,101 £41,250
25th Percentile £52,000 £47,500 £52,500
Median annual salary (50th Percentile) £70,000 £65,000 £69,447
Median % change year-on-year +7.69% -6.40% -0.79%
75th Percentile £90,000 £83,750 £88,750
90th Percentile £115,000 £102,500 £105,000
UK median annual salary £68,500 £60,000 £67,500
% change year-on-year +14.17% -11.11% -3.57%

Failover Clustering
Trend for Jobs with a WFH Option

Job vacancies with remote working options citing Failover Clustering as a proportion of all IT jobs advertised.
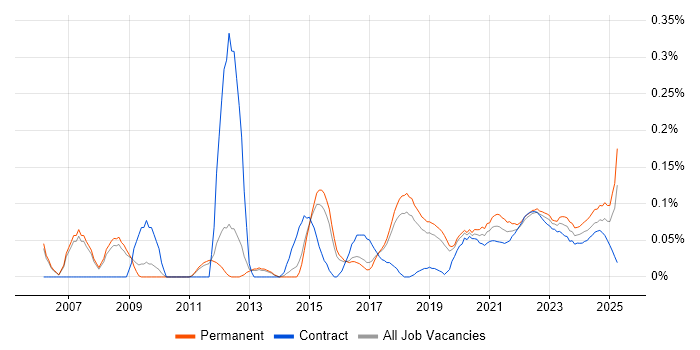
Failover Clustering trend for jobs with Hybrid/Remote/WFH options

Failover Clustering
Salary Trend for Jobs with a WFH Option

3-month moving average salary quoted in job vacancies with remote working options citing Failover Clustering.

Failover Clustering salary trend for jobs with a WFH option

Failover Clustering
Salary Histogram for Jobs with a WFH Option

Salary distribution for jobs with remote working options citing Failover Clustering over the 6 months to 1 May 2025.

Failover Clustering salary histogram for jobs with a WFH option

Failover Clustering
Co-occurring Skills and Capabilities with WFH Options by Category

The follow tables expand on the table above by listing co-occurrences grouped by category. The same employment type, locality and period is covered with up to 20 co-occurrences shown in each of the following categories:

Application Platforms
1 8 (53.33%) Microsoft Exchange
2 1 (6.67%) IIS
Cloud Services
1 13 (86.67%) Azure
2 8 (53.33%) Power Platform
2 8 (53.33%) SaaS
3 5 (33.33%) AWS
4 4 (26.67%) Azure Monitor
4 4 (26.67%) Datadog
4 4 (26.67%) GCP
Communications & Networking
1 5 (33.33%) Firewall
2 3 (20.00%) DNS
3 2 (13.33%) VSAN
4 1 (6.67%) DHCP
4 1 (6.67%) TCP/IP
4 1 (6.67%) VPN
Database & Business Intelligence
1 13 (86.67%) SQL Server
2 8 (53.33%) Data Hub
2 8 (53.33%) Metadata
2 8 (53.33%) Power BI
2 8 (53.33%) SQL CLR
2 8 (53.33%) SQL Server Analysis Services
2 8 (53.33%) SQL Server Reporting Services
General
1 8 (53.33%) Back Office
1 8 (53.33%) Finance
2 6 (40.00%) Social Skills
3 2 (13.33%) Analytical Skills
Job Titles
1 8 (53.33%) Developer
1 8 (53.33%) Microsoft Developer
1 8 (53.33%) SaaS Developer
1 8 (53.33%) Senior
1 8 (53.33%) Senior Developer
1 8 (53.33%) Senior Microsoft Developer
1 8 (53.33%) Senior SQL Developer
1 8 (53.33%) SQL Developer
2 5 (33.33%) Infrastructure Manager
3 4 (26.67%) IT Infrastructure Manager
3 4 (26.67%) IT Manager
4 2 (13.33%) Infrastructure Engineer
4 2 (13.33%) Platform Manager
Libraries, Frameworks & Software Standards
1 4 (26.67%) Elastic Stack
Miscellaneous
1 8 (53.33%) Private Cloud
2 7 (46.67%) Data Centre
3 5 (33.33%) Clustering
3 5 (33.33%) Replication
4 4 (26.67%) Cyber Threat
4 4 (26.67%) Management Information System
5 2 (13.33%) Linux Command Line
Operating Systems
1 7 (46.67%) Linux
1 7 (46.67%) Windows
2 3 (20.00%) Windows Server
3 2 (13.33%) Red Hat Enterprise Linux
Processes & Methodologies
1 11 (73.33%) Infrastructure Engineering
2 10 (66.67%) High Availability
2 10 (66.67%) Performance Tuning
3 8 (53.33%) Business Intelligence
3 8 (53.33%) Data Privacy
3 8 (53.33%) Fintech
3 8 (53.33%) Migration
3 8 (53.33%) Refactoring
3 8 (53.33%) Statistics
3 8 (53.33%) Wealth Management
3 8 (53.33%) Workflow
4 6 (40.00%) Problem-Solving
5 4 (26.67%) Agile
5 4 (26.67%) Collaborative Culture
5 4 (26.67%) Computer Science
5 4 (26.67%) Infrastructure Automation
5 4 (26.67%) Observability
5 4 (26.67%) Strategic Thinking
6 2 (13.33%) Problem Management
6 2 (13.33%) Security Monitoring
Programming Languages
1 10 (66.67%) SQL
2 8 (53.33%) T-SQL
3 4 (26.67%) Bash
3 4 (26.67%) JavaScript
3 4 (26.67%) Python
3 4 (26.67%) TypeScript
4 3 (20.00%) PowerShell
Qualifications
1 4 (26.67%) Computer Science Degree
1 4 (26.67%) Degree
2 2 (13.33%) CCNA
2 2 (13.33%) CCNP
2 2 (13.33%) Cisco Certification
2 2 (13.33%) MCP
2 2 (13.33%) MCSA
2 2 (13.33%) Microsoft Certification
2 2 (13.33%) VMware Certified Professional (VCP)
Quality Assurance & Compliance
1 1 (6.67%) SLA
System Software
1 10 (66.67%) VMware Infrastructure
2 7 (46.67%) Active Directory
3 5 (33.33%) Docker
3 5 (33.33%) Hyper-V
4 2 (13.33%) EMC RecoverPoint
4 2 (13.33%) Firmware
4 2 (13.33%) Virtual Machines
4 2 (13.33%) VMware NSX
4 2 (13.33%) vSphere
Systems Management
1 4 (26.67%) Kubernetes
1 4 (26.67%) Prometheus
1 4 (26.67%) Terraform
2 2 (13.33%) Dell DRAC
2 2 (13.33%) vCenter Server
2 2 (13.33%) vRealize
2 2 (13.33%) VxRail
2 2 (13.33%) WSUS
Vendors
1 14 (93.33%) VMware
2 11 (73.33%) Microsoft
3 2 (13.33%) Dell
3 2 (13.33%) EMC
3 2 (13.33%) Isilon
3 2 (13.33%) McAfee
3 2 (13.33%) Red Hat
3 2 (13.33%) SolarWinds
4 1 (6.67%) Cisco