IIS Jobs with Hybrid/Remote/WFH Options

Microsoft Internet Information Services (IIS)
UK > Work from Home

The table below provides summary statistics for permanent remote or hybrid work requiring IIS skills. It includes a benchmarking guide to the annual salaries offered in vacancies that cited IIS over the 6 months leading up to 18 July 2025, comparing them to the same period in the previous two years.

6 months to
18 Jul 2025
Same period 2024 Same period 2023
Rank 387 317 431
Rank change year-on-year -70 +114 +31
Permanent jobs citing IIS 82 268 185
As % of all permanent jobs with a WFH option 0.39% 0.85% 0.54%
As % of the Application Platforms category 4.27% 6.82% 4.75%
Number of salaries quoted 63 216 156
10th Percentile £26,250 £39,750 £36,500
25th Percentile £37,375 £48,750 £43,438
Median annual salary (50th Percentile) £44,000 £60,000 £55,000
Median % change year-on-year -26.67% +9.09% +10.00%
75th Percentile £62,500 £64,750 £67,500
90th Percentile £72,500 £70,000 £80,000
UK median annual salary £48,500 £52,500 £55,000
% change year-on-year -7.62% -4.55% +10.00%

All Application Platform Skills
Work from Home

IIS falls under the Application Platforms category. For comparison with the information above, the following table provides summary statistics for all permanent job vacancies with remote or hybrid options requiring application platform skills.

Permanent vacancies with a requirement for application platform skills 1,920 3,930 3,895
As % of all permanent jobs with a WFH option 9.10% 12.45% 11.37%
Number of salaries quoted 1,200 2,879 3,144
10th Percentile £31,000 £31,500 £32,500
25th Percentile £40,000 £42,393 £43,750
Median annual salary (50th Percentile) £58,500 £60,000 £60,000
Median % change year-on-year -2.50% - +9.09%
75th Percentile £90,000 £95,000 £79,523
90th Percentile £115,000 £142,500 £102,500
UK median annual salary £53,688 £50,000 £55,043
% change year-on-year +7.38% -9.16% +0.08%

IIS
Trend for Jobs with a WFH Option

Job vacancies with remote working options citing IIS as a proportion of all IT jobs advertised.
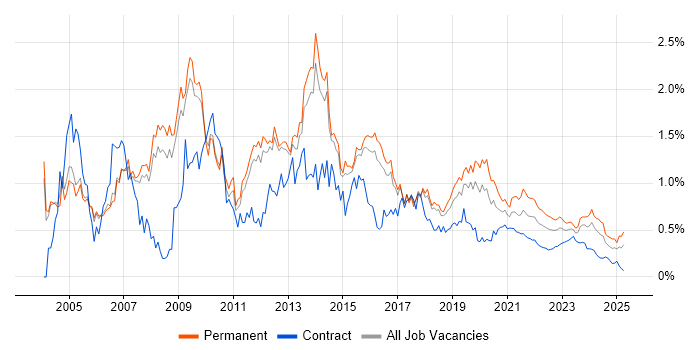
IIS trend for jobs with Hybrid/Remote/WFH options

IIS
Salary Trend for Jobs with a WFH Option

3-month moving average salary quoted in job vacancies with remote working options citing IIS.

IIS salary trend for jobs with a WFH option

IIS
Salary Histogram for Jobs with a WFH Option

Salary distribution for jobs with remote working options citing IIS over the 6 months to 18 July 2025.

IIS salary histogram for jobs with a WFH option

IIS
Co-occurring Skills and Capabilities with WFH Options by Category

The follow tables expand on the table above by listing co-occurrences grouped by category. The same employment type, locality and period is covered with up to 20 co-occurrences shown in each of the following categories:

Application Platforms
1 23 (28.05%) Microsoft Exchange
2 11 (13.41%) Tomcat
3 9 (10.98%) SharePoint
4 8 (9.76%) Apache
5 4 (4.88%) nginx
6 2 (2.44%) CMS
7 1 (1.22%) Apache Airflow
7 1 (1.22%) BizTalk Server
7 1 (1.22%) Umbraco
Applications
1 10 (12.20%) Microsoft Office
2 1 (1.22%) Adobe Illustrator
2 1 (1.22%) Microsoft Excel
Business Applications
1 1 (1.22%) Dynamics CRM
1 1 (1.22%) Magento
Cloud Services
1 36 (43.90%) Azure
2 18 (21.95%) Microsoft 365
2 18 (21.95%) SaaS
3 16 (19.51%) AWS
3 16 (19.51%) Entra ID
4 15 (18.29%) GitHub
5 13 (15.85%) Cloudflare
6 9 (10.98%) Microsoft Copilot
6 9 (10.98%) Power Automate
7 6 (7.32%) Azure DevOps
8 5 (6.10%) Nutanix
9 4 (4.88%) Azure AKS
9 4 (4.88%) Azure Cosmos DB
9 4 (4.88%) Azure Monitor
9 4 (4.88%) Azure Pipelines
9 4 (4.88%) Azure Service Bus
10 3 (3.66%) IaaS
10 3 (3.66%) Mimecast
10 3 (3.66%) PaaS
11 2 (2.44%) Sage Pay
Communications & Networking
1 29 (35.37%) DNS
2 23 (28.05%) Firewall
3 20 (24.39%) DHCP
4 10 (12.20%) SSL
5 9 (10.98%) DMARC
6 8 (9.76%) TCP/IP
7 6 (7.32%) Remote Desktop
7 6 (7.32%) SAN
8 5 (6.10%) ADSL
8 5 (6.10%) VLAN
8 5 (6.10%) VoIP
8 5 (6.10%) VPN
9 1 (1.22%) FTP
9 1 (1.22%) HTTP
9 1 (1.22%) SMTP
9 1 (1.22%) Wireless
Database & Business Intelligence
1 62 (75.61%) SQL Server
2 13 (15.85%) Data Hub
2 13 (15.85%) SQL CLR
3 10 (12.20%) PostgreSQL
4 9 (10.98%) Elasticsearch
4 9 (10.98%) MySQL
5 6 (7.32%) GIS
5 6 (7.32%) Relational Database
6 5 (6.10%) Amazon RDS
7 4 (4.88%) Azure SQL Database
8 1 (1.22%) Redis
Development Applications
1 16 (19.51%) Git
2 9 (10.98%) TeamCity
3 8 (9.76%) Jasmine
3 8 (9.76%) NUnit
4 5 (6.10%) Octopus Deploy
5 2 (2.44%) JIRA
6 1 (1.22%) Artifactory
6 1 (1.22%) Log4Net
6 1 (1.22%) SQL Server Management Studio (SSMS)
6 1 (1.22%) Team Foundation Server
General
1 37 (45.12%) Social Skills
2 21 (25.61%) Finance
3 18 (21.95%) Back Office
4 9 (10.98%) Czech Language
4 9 (10.98%) Organisational Skills
4 9 (10.98%) Presentation Skills
5 7 (8.54%) Games
6 6 (7.32%) Advertising
7 5 (6.10%) Local Government
7 5 (6.10%) Public Sector
8 3 (3.66%) Inclusion and Diversity
9 2 (2.44%) Marketing
10 1 (1.22%) Analytical Skills
10 1 (1.22%) Law
Job Titles
1 15 (18.29%) Developer
1 15 (18.29%) Senior
2 14 (17.07%) IT Support
3 13 (15.85%) Head of Development
4 11 (13.41%) .NET Developer
4 11 (13.41%) 3rd Line Support
4 11 (13.41%) Infrastructure Engineer
5 10 (12.20%) Administrator
5 10 (12.20%) Analyst
5 10 (12.20%) Full-Stack Developer
6 9 (10.98%) IT Administrator
7 8 (9.76%) Azure Engineer
7 8 (9.76%) Senior Developer
7 8 (9.76%) Senior Full-Stack Developer
8 7 (8.54%) 3rd Line Engineer
8 7 (8.54%) Full-Stack .NET Developer
9 6 (7.32%) 3rd Line Support Engineer
9 6 (7.32%) Applications Support
9 6 (7.32%) Support Engineer
9 6 (7.32%) Support Specialist
Libraries, Frameworks & Software Standards
1 34 (41.46%) .NET
2 18 (21.95%) .NET Core
3 16 (19.51%) .NET Framework
4 15 (18.29%) HTML
5 14 (17.07%) ASP.NET
6 13 (15.85%) CSS
6 13 (15.85%) Dapper ORM
6 13 (15.85%) Entity Framework
6 13 (15.85%) JSON
7 12 (14.63%) XML
8 11 (13.41%) AngularJS
8 11 (13.41%) REST
9 10 (12.20%) HTML5
9 10 (12.20%) React
10 9 (10.98%) ASP.NET Core
10 9 (10.98%) CSS3
10 9 (10.98%) SOAP
10 9 (10.98%) Vue
11 8 (9.76%) Jest
11 8 (9.76%) RESTful
Miscellaneous
1 13 (15.85%) Private Cloud
1 13 (15.85%) Self-Motivation
1 13 (15.85%) Team-Oriented Environment
2 12 (14.63%) Enterprise Software
3 8 (9.76%) Onboarding
4 6 (7.32%) Data Centre
5 5 (6.10%) Client/Server
5 5 (6.10%) Management Information System
6 4 (4.88%) Clustering
6 4 (4.88%) Online Games
7 3 (3.66%) Enterprise Cloud
7 3 (3.66%) Mobile App
8 2 (2.44%) Cyber Security Posture
8 2 (2.44%) Security Posture
9 1 (1.22%) Cloud Native
9 1 (1.22%) Graphic Design
9 1 (1.22%) Legacy Systems
9 1 (1.22%) PKI
9 1 (1.22%) Public Cloud
Operating Systems
1 69 (84.15%) Windows
2 52 (63.41%) Windows Server
3 26 (31.71%) Linux
4 12 (14.63%) Unix
5 4 (4.88%) CentOS
5 4 (4.88%) Windows Server 2016
6 1 (1.22%) Debian
6 1 (1.22%) Mac OS
6 1 (1.22%) Windows Server 2012
Processes & Methodologies
1 32 (39.02%) Problem-Solving
2 29 (35.37%) Agile
3 25 (30.49%) Full-Stack Development
3 25 (30.49%) Infrastructure Engineering
4 22 (26.83%) Data Privacy
5 19 (23.17%) ITIL
5 19 (23.17%) Project Delivery
6 16 (19.51%) High Availability
6 16 (19.51%) Project Management
7 14 (17.07%) Clean Code
7 14 (17.07%) Collaborative Culture
7 14 (17.07%) Customer Service
7 14 (17.07%) MVC
7 14 (17.07%) Software Engineering
8 13 (15.85%) Continuous Improvement
8 13 (15.85%) Fintech
8 13 (15.85%) Performance Tuning
8 13 (15.85%) SOLID
8 13 (15.85%) TDD
8 13 (15.85%) Workflow
Programming Languages
1 44 (53.66%) SQL
2 32 (39.02%) C#
3 28 (34.15%) PowerShell
4 24 (29.27%) JavaScript
5 10 (12.20%) Java
6 9 (10.98%) TypeScript
6 9 (10.98%) VBA
7 8 (9.76%) Python
8 7 (8.54%) Bicep
9 3 (3.66%) Bash
10 1 (1.22%) PHP
Qualifications
1 5 (6.10%) A+ Certification
1 5 (6.10%) Network+ Certification
2 4 (4.88%) Azure Certification
3 3 (3.66%) Degree
3 3 (3.66%) Microsoft Certification
4 1 (1.22%) Computer Science Degree
4 1 (1.22%) DBS Check
Quality Assurance & Compliance
1 11 (13.41%) ISO/IEC 27001
2 2 (2.44%) Cyber Essentials
2 2 (2.44%) Cyber Essentials PLUS
2 2 (2.44%) NIST
System Software
1 37 (45.12%) Active Directory
2 29 (35.37%) VMware Infrastructure
3 11 (13.41%) Hyper-V
4 8 (9.76%) vSphere
5 6 (7.32%) Terminal Services
6 5 (6.10%) Docker
6 5 (6.10%) Virtual Machines
7 2 (2.44%) VMware ESXi
7 2 (2.44%) VMware NSX
8 1 (1.22%) Forefront TMG
8 1 (1.22%) ISA Server
Systems Management
1 18 (21.95%) Microsoft Intune
2 12 (14.63%) Terraform
3 11 (13.41%) Single Sign-On
4 7 (8.54%) Ansible
5 5 (6.10%) Kubernetes
5 5 (6.10%) ZABBIX
6 4 (4.88%) Grafana
6 4 (4.88%) Prometheus
6 4 (4.88%) SCCM
7 2 (2.44%) Proxmox
8 1 (1.22%) SCOM
Vendors
1 58 (70.73%) Microsoft
2 37 (45.12%) VMware
3 14 (17.07%) Oracle
4 8 (9.76%) Rollbar
5 7 (8.54%) NetApp
6 6 (7.32%) Dell
6 6 (7.32%) HP
7 4 (4.88%) Cisco
8 3 (3.66%) Palo Alto
8 3 (3.66%) SolarWinds
9 1 (1.22%) Adobe
9 1 (1.22%) Apple
9 1 (1.22%) F5
9 1 (1.22%) Fortinet
9 1 (1.22%) Okta
9 1 (1.22%) PayPal
9 1 (1.22%) Pega
9 1 (1.22%) Salesforce
9 1 (1.22%) Veeam