Replication Jobs with Work from Home Options

Replication
UK > Work from Home

The table below looks at the prevalence of the term Replication in remote or hybrid work. Included is a benchmarking guide to the salaries offered in vacancies that cited Replication over the 6 months leading up to 26 July 2024, comparing them to the same period in the previous two years.

6 months to
26 Jul 2024
Same period 2023 Same period 2022
Rank 425 454 672
Rank change year-on-year +29 +218 -160
Permanent jobs citing Replication 108 126 244
As % of all permanent jobs with a WFH option 0.39% 0.38% 0.31%
As % of the Miscellaneous category 1.12% 0.99% 0.67%
Number of salaries quoted 81 118 178
10th Percentile £29,000 £32,200 £40,000
25th Percentile £35,000 £42,688 £42,813
Median annual salary (50th Percentile) £52,500 £58,750 £55,000
Median % change year-on-year -10.64% +6.82% +4.76%
75th Percentile £68,750 £67,070 £65,000
90th Percentile £102,500 £75,000 £75,925
UK median annual salary £49,250 £55,000 £55,000
% change year-on-year -10.45% - +15.79%

All Generic Skills
Work from Home

Replication falls under the General and Transferable Skills category. For comparison with the information above, the following table provides summary statistics for all permanent job vacancies with remote or hybrid options requiring generic IT skills.

Permanent vacancies with a requirement for generic IT skills 9,605 12,729 36,632
As % of all permanent jobs with a WFH option 34.38% 38.79% 46.65%
Number of salaries quoted 6,855 9,924 18,426
10th Percentile £33,500 £40,000 £37,500
25th Percentile £45,000 £50,000 £47,500
Median annual salary (50th Percentile) £60,000 £65,000 £65,000
Median % change year-on-year -7.69% - +8.33%
75th Percentile £83,750 £85,000 £85,000
90th Percentile £117,500 £107,500 £100,000
UK median annual salary £55,000 £64,000 £62,500
% change year-on-year -14.06% +2.40% +4.17%

Replication
Trend for Jobs with a WFH Option

Job vacancies with a work from home option citing Replication as a proportion of all IT jobs advertised.
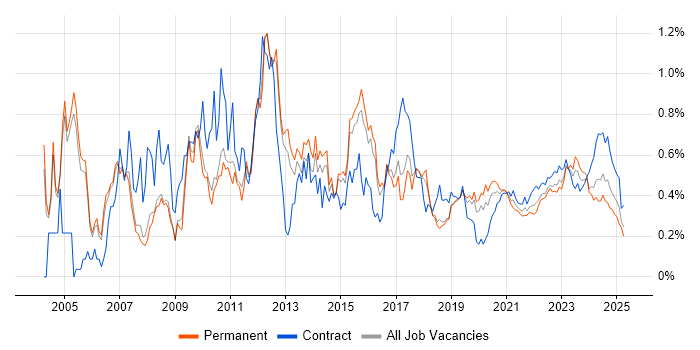
Replication trend for jobs with a WFH option

Replication
Salary Trend for Jobs with a WFH Option

3-month moving average salary quoted in job vacancies with a work from home option citing Replication.

Replication salary trend for jobs with a WFH option

Replication
Salary Histogram for Jobs with a WFH Option

Salary distribution for jobs with a work from home option citing Replication over the 6 months to 26 July 2024.

Replication salary histogram for jobs with a WFH option

Replication
Co-occurring Skills and Capabilities with WFH Options by Category

The follow tables expand on the table above by listing co-occurrences grouped by category. The same employment type, locality and period is covered with up to 20 co-occurrences shown in each of the following categories:

Application Platforms
1 18 (16.67%) Microsoft Exchange
2 9 (8.33%) SharePoint
3 4 (3.70%) IIS
4 1 (0.93%) Blackberry Enterprise Server
4 1 (0.93%) Site Server
4 1 (0.93%) Skype for Business
Applications
1 11 (10.19%) Microsoft Office
Business Applications
1 4 (3.70%) BASE24
Cloud Services
1 55 (50.93%) Azure
2 41 (37.96%) Microsoft 365
3 21 (19.44%) Entra ID
4 14 (12.96%) AWS
5 11 (10.19%) SaaS
6 10 (9.26%) IaaS
7 4 (3.70%) Amazon CloudWatch
7 4 (3.70%) OCI
8 3 (2.78%) OneDrive
9 2 (1.85%) Amazon EC2
9 2 (1.85%) Amazon S3
9 2 (1.85%) AWS KMS
9 2 (1.85%) PaaS
10 1 (0.93%) Mimecast
10 1 (0.93%) Power Platform
Communications & Networking
1 36 (33.33%) Firewall
2 29 (26.85%) SAN
3 18 (16.67%) DHCP
3 18 (16.67%) DNS
4 11 (10.19%) Remote Desktop
5 9 (8.33%) TCP/IP
5 9 (8.33%) Wireless
6 8 (7.41%) Internet
6 8 (7.41%) Wi-Fi
7 7 (6.48%) Fibre Channel
8 6 (5.56%) Skype
8 6 (5.56%) VLAN
9 5 (4.63%) Broadband
9 5 (4.63%) iSCSI
9 5 (4.63%) Multicast
9 5 (4.63%) VoIP
10 4 (3.70%) Unicast
10 4 (3.70%) VPN
11 2 (1.85%) NetScaler
11 2 (1.85%) NGFW
Database & Business Intelligence
1 37 (34.26%) SQL Server
2 17 (15.74%) SQL Server Reporting Services
3 10 (9.26%) SQL Server Integration Services
4 9 (8.33%) Amazon RDS
5 7 (6.48%) Data Warehouse
6 5 (4.63%) DB2
6 5 (4.63%) InfluxDB
6 5 (4.63%) MongoDB
6 5 (4.63%) MySQL
6 5 (4.63%) NoSQL
7 4 (3.70%) Amazon Aurora
7 4 (3.70%) DynamoDB
7 4 (3.70%) NonStop SQL
7 4 (3.70%) PostgreSQL
8 3 (2.78%) Relational Database
9 2 (1.85%) MariaDB
10 1 (0.93%) Oracle Database
10 1 (0.93%) QlikView
10 1 (0.93%) SQL Server Analysis Services
10 1 (0.93%) Tableau
Development Applications
1 10 (9.26%) Git
1 10 (9.26%) Jenkins
1 10 (9.26%) TeamCity
2 5 (4.63%) Cypress.io
2 5 (4.63%) JIRA
2 5 (4.63%) Postman
2 5 (4.63%) Selenium
General
1 34 (31.48%) Finance
2 17 (15.74%) Social Skills
3 11 (10.19%) Banking
4 9 (8.33%) Analytical Skills
5 8 (7.41%) Financial Institution
6 4 (3.70%) Telecoms
7 2 (1.85%) Retail
8 1 (0.93%) Advertising
8 1 (0.93%) Games
8 1 (0.93%) Inclusion and Diversity
8 1 (0.93%) Law
8 1 (0.93%) Organisational Skills
Job Titles
1 15 (13.89%) IT Support
2 14 (12.96%) DBA
3 13 (12.04%) 3rd Line Support
3 13 (12.04%) Analyst
3 13 (12.04%) Lead
3 13 (12.04%) Senior
3 13 (12.04%) Support Engineer
4 11 (10.19%) Administrator
4 11 (10.19%) Technical Leader
5 10 (9.26%) Architect
5 10 (9.26%) IT Engineer
6 8 (7.41%) Infrastructure Engineer
6 8 (7.41%) IT Support Engineer
6 8 (7.41%) Platform Engineer
7 7 (6.48%) IT Support Analyst
7 7 (6.48%) Junior Analyst
7 7 (6.48%) Junior IT Support
7 7 (6.48%) Junior IT Support Analyst
7 7 (6.48%) Junior Support Analyst
7 7 (6.48%) Senior Infrastructure Engineer
Libraries, Frameworks & Software Standards
1 8 (7.41%) Kafka
1 8 (7.41%) Middleware
2 5 (4.63%) Nightwatchjs
3 4 (3.70%) Oracle GoldenGate
4 3 (2.78%) REST
Miscellaneous
1 22 (20.37%) Clustering
2 13 (12.04%) Driving Licence
3 10 (9.26%) Data Centre
4 8 (7.41%) Cyber Threat
4 8 (7.41%) Cyberattack
4 8 (7.41%) Data Fabric
5 5 (4.63%) Mobile App
5 5 (4.63%) Product Ownership
6 4 (3.70%) Onboarding
7 2 (1.85%) EMC VMAX
7 2 (1.85%) Private Cloud
8 1 (0.93%) Blackberry
8 1 (0.93%) Enterprise Storage
8 1 (0.93%) iSeries
8 1 (0.93%) Legacy Systems
8 1 (0.93%) PKI
8 1 (0.93%) PMI
8 1 (0.93%) Public Cloud
8 1 (0.93%) Self-Motivation
8 1 (0.93%) Video Conferencing
Operating Systems
1 64 (59.26%) Windows
2 31 (28.70%) Linux
3 27 (25.00%) Windows Server
4 19 (17.59%) Windows Server 2019
5 18 (16.67%) Solaris
6 17 (15.74%) Windows 10
7 13 (12.04%) Android
7 13 (12.04%) Apple iOS
7 13 (12.04%) Ubuntu
8 12 (11.11%) Windows Server 2016
9 11 (10.19%) Red Hat Enterprise Linux
9 11 (10.19%) Unix
10 10 (9.26%) Oracle Linux
11 8 (7.41%) CentOS
11 8 (7.41%) zOS
12 6 (5.56%) Windows Server 2012
13 4 (3.70%) Amazon Linux
14 1 (0.93%) AIX
14 1 (0.93%) Mac OS X
Processes & Methodologies
1 35 (32.41%) Disaster Recovery
2 23 (21.30%) High Availability
3 22 (20.37%) ITIL
4 20 (18.52%) Customer Service
5 19 (17.59%) Performance Tuning
6 18 (16.67%) Project Delivery
7 15 (13.89%) Infrastructure as Code
8 14 (12.96%) Problem-Solving
9 12 (11.11%) ETL
10 11 (10.19%) Service Management
11 10 (9.26%) CI/CD
11 10 (9.26%) Continuous Improvement
11 10 (9.26%) Data Management
11 10 (9.26%) Deployment Automation
11 10 (9.26%) Security Hardening
12 9 (8.33%) Infrastructure Engineering
12 9 (8.33%) Logistics
13 8 (7.41%) Cybersecurity
13 8 (7.41%) Project Management
13 8 (7.41%) Ticket Management
Programming Languages
1 34 (31.48%) PowerShell
2 32 (29.63%) SQL
3 15 (13.89%) Python
4 14 (12.96%) Bash
5 12 (11.11%) T-SQL
6 10 (9.26%) C#
7 5 (4.63%) JavaScript
7 5 (4.63%) TypeScript
8 2 (1.85%) Perl
Qualifications
1 25 (23.15%) Degree
2 9 (8.33%) MCP
3 8 (7.41%) CCA
3 8 (7.41%) Citrix Certification
3 8 (7.41%) Computer Science Degree
3 8 (7.41%) DBS Check
4 5 (4.63%) Microsoft Certification
5 4 (3.70%) VMware Certified Professional (VCP)
6 2 (1.85%) CCNA
6 2 (1.85%) Cisco Certification
6 2 (1.85%) MCSA
6 2 (1.85%) MCSE
7 1 (0.93%) IBM Certification
7 1 (0.93%) ITIL Certification
7 1 (0.93%) LPIC
7 1 (0.93%) PMI Certification
Quality Assurance & Compliance
1 8 (7.41%) Cyber Essentials
2 5 (4.63%) QA
3 2 (1.85%) SLA
4 1 (0.93%) GDPR
System Software
1 42 (38.89%) Active Directory
2 26 (24.07%) Hyper-V
3 24 (22.22%) VMware Infrastructure
4 10 (9.26%) Docker
4 10 (9.26%) XenDesktop
5 8 (7.41%) vSphere
5 8 (7.41%) XenApp
6 7 (6.48%) Terminal Services
6 7 (6.48%) VMware ESXi
7 4 (3.70%) Ceph
8 3 (2.78%) Virtual Machines
9 1 (0.93%) DFS Replication
9 1 (0.93%) Firmware
9 1 (0.93%) Microsoft App-V
9 1 (0.93%) Veritas Cluster Server
Systems Management
1 16 (14.81%) Terraform
2 15 (13.89%) Microsoft Intune
2 15 (13.89%) SCCM
3 13 (12.04%) Ansible
4 10 (9.26%) Active Directory Federation Services
4 10 (9.26%) Kubernetes
5 8 (7.41%) Backup Exec
5 8 (7.41%) SCOM
5 8 (7.41%) Symantec Endpoint Protection
6 7 (6.48%) Microsoft Clustering
6 7 (6.48%) PaperCut
7 5 (4.63%) Grafana
7 5 (4.63%) Prometheus
8 4 (3.70%) Istio
9 3 (2.78%) N-central
9 3 (2.78%) NetBackup
9 3 (2.78%) Puppet
10 2 (1.85%) vCenter Server
10 2 (1.85%) WSUS
11 1 (0.93%) Trend Micro Deep Security
Vendors
1 44 (40.74%) Microsoft
2 28 (25.93%) Veeam
2 28 (25.93%) VMware
3 19 (17.59%) Cisco
3 19 (17.59%) Citrix
3 19 (17.59%) IBM
4 16 (14.81%) Oracle
5 14 (12.96%) Dell
6 13 (12.04%) Fortinet
7 10 (9.26%) Serena
8 9 (8.33%) Veritas
9 8 (7.41%) N-able
9 8 (7.41%) Sophos
9 8 (7.41%) Symantec
10 7 (6.48%) BT
10 7 (6.48%) Canon
10 7 (6.48%) Meraki
10 7 (6.48%) Zerto
11 6 (5.56%) HP
11 6 (5.56%) NEC