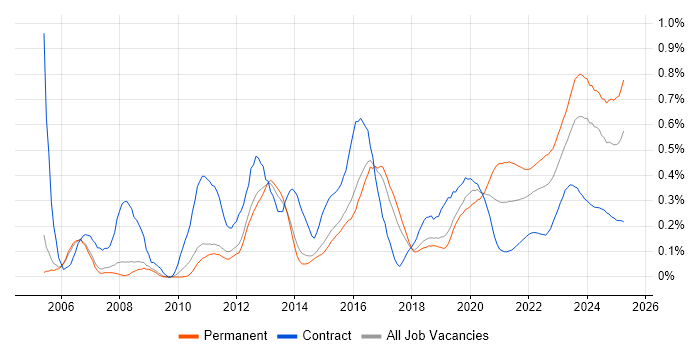
Firmware Jobs with Hybrid/Remote/WFH Options

Firmware
UK > Work from Home

The table below provides summary statistics for permanent remote or hybrid work requiring Firmware skills. It includes a benchmarking guide to the annual salaries offered in vacancies that cited Firmware over the 6 months leading up to 1 May 2025, comparing them to the same period in the previous two years.

6 months to
1 May 2025
Same period 2024 Same period 2023
Rank 282 322 474
Rank change year-on-year +40 +152 +113
Permanent jobs citing Firmware 117 303 204
As % of all permanent jobs with a WFH option 0.78% 0.90% 0.48%
As % of the System Software category 6.20% 6.94% 3.20%
Number of salaries quoted 77 256 131
10th Percentile £37,500 £35,000 £31,250
25th Percentile £50,000 £45,000 £41,250
Median annual salary (50th Percentile) £60,000 £52,500 £60,000
Median % change year-on-year +14.29% -12.50% +9.09%
75th Percentile £73,750 £60,750 £75,000
90th Percentile £88,500 £66,250 £85,000
UK median annual salary £57,500 £52,500 £47,500
% change year-on-year +9.52% +10.53% -13.64%

All System Software Skills
Work from Home

Firmware falls under the System Software category. For comparison with the information above, the following table provides summary statistics for all permanent job vacancies with remote or hybrid options requiring system software skills.

Permanent vacancies with a requirement for system software skills 1,887 4,369 6,374
As % of all permanent jobs with a WFH option 12.62% 12.91% 14.91%
Number of salaries quoted 1,533 3,497 4,708
10th Percentile £30,750 £32,000 £31,250
25th Percentile £41,250 £41,250 £42,500
Median annual salary (50th Percentile) £60,000 £55,000 £60,000
Median % change year-on-year +9.09% -8.33% -4.00%
75th Percentile £82,500 £71,250 £80,000
90th Percentile £115,000 £86,550 £95,000
UK median annual salary £55,000 £50,000 £55,000
% change year-on-year +10.00% -9.09% -2.35%

Firmware
Trend for Jobs with a WFH Option

Job vacancies with remote working options citing Firmware as a proportion of all IT jobs advertised.

Firmware trend for jobs with Hybrid/Remote/WFH options

Firmware
Salary Trend for Jobs with a WFH Option

3-month moving average salary quoted in job vacancies with remote working options citing Firmware.

Firmware salary trend for jobs with a WFH option

Firmware
Salary Histogram for Jobs with a WFH Option

Salary distribution for jobs with remote working options citing Firmware over the 6 months to 1 May 2025.

Firmware salary histogram for jobs with a WFH option

Firmware
Co-occurring Skills and Capabilities with WFH Options by Category

The follow tables expand on the table above by listing co-occurrences grouped by category. The same employment type, locality and period is covered with up to 20 co-occurrences shown in each of the following categories:

Application Platforms
1 1 (0.85%) Microsoft Exchange
Applications
1 11 (9.40%) Microsoft Office
2 5 (4.27%) Simulink
Business Applications
1 2 (1.71%) Remedy ITSM
Cloud Services
1 7 (5.98%) Azure
2 6 (5.13%) AWS
3 5 (4.27%) GitHub
4 4 (3.42%) Microsoft 365
5 3 (2.56%) AWS Direct Connect
5 3 (2.56%) Entra ID
Communications & Networking
1 20 (17.09%) Firewall
2 18 (15.38%) TCP/IP
2 18 (15.38%) WAN
3 17 (14.53%) Modbus
4 13 (11.11%) SD-WAN
4 13 (11.11%) Wi-Fi
4 13 (11.11%) Wireless
5 11 (9.40%) Bluetooth
5 11 (9.40%) VPN
6 10 (8.55%) LAN
6 10 (8.55%) ZigBee
7 9 (7.69%) DNS
8 8 (6.84%) Cisco ASA
8 8 (6.84%) RS-232
9 7 (5.98%) Cisco Firepower
9 7 (5.98%) Profibus
9 7 (5.98%) RS-485
10 5 (4.27%) Internet
10 5 (4.27%) MPLS
10 5 (4.27%) Network Security
Database & Business Intelligence
1 1 (0.85%) SQL Server
Development Applications
1 10 (8.55%) Git
2 6 (5.13%) Eclipse
3 5 (4.27%) Subversion
4 3 (2.56%) GDB
5 1 (0.85%) Appium
5 1 (0.85%) TestRail
General
1 48 (41.03%) Electronics
2 31 (26.50%) Social Skills
3 24 (20.51%) Finance
4 14 (11.97%) Analytical Skills
5 12 (10.26%) Presentation Skills
6 9 (7.69%) Manufacturing
7 7 (5.98%) Organisational Skills
8 6 (5.13%) Inclusion and Diversity
9 3 (2.56%) Banking
10 2 (1.71%) Aerospace
10 2 (1.71%) Telecoms
10 2 (1.71%) Wearables
11 1 (0.85%) Advertising
11 1 (0.85%) Automotive
11 1 (0.85%) Documentation Skills
11 1 (0.85%) Military
Job Titles
1 60 (51.28%) Senior
2 30 (25.64%) Embedded Engineer
3 26 (22.22%) Electronics Engineer
4 25 (21.37%) Senior Electronics Engineer
5 24 (20.51%) Design Engineer
5 24 (20.51%) Senior Embedded Engineer
6 23 (19.66%) Firmware Engineer
7 21 (17.95%) Electronics Design Engineer
7 21 (17.95%) Senior Design Engineer
8 20 (17.09%) Senior Electronics Design Engineer
9 17 (14.53%) Senior Firmware Engineer
10 16 (13.68%) Network Engineer
11 15 (12.82%) Embedded Firmware Engineer
12 14 (11.97%) Embedded Software Engineer
12 14 (11.97%) Software Engineer
13 12 (10.26%) Hardware Engineer
14 11 (9.40%) Senior Embedded Software Engineer
14 11 (9.40%) Senior Software Engineer
15 10 (8.55%) FPGA Engineer
15 10 (8.55%) Lead
Libraries, Frameworks & Software Standards
1 6 (5.13%) .NET
2 3 (2.56%) OpenEmbedded
2 3 (2.56%) REST
2 3 (2.56%) Yocto
3 2 (1.71%) GraphQL
3 2 (1.71%) Middleware
3 2 (1.71%) SAML
4 1 (0.85%) WSH
Miscellaneous
1 28 (23.93%) FPGA
2 21 (17.95%) Embedded Systems
3 20 (17.09%) Optoelectronics
4 17 (14.53%) VHDL
5 9 (7.69%) Data Centre
5 9 (7.69%) Device Driver
5 9 (7.69%) Product Ownership
5 9 (7.69%) Verilog
6 8 (6.84%) Self-Motivation
7 7 (5.98%) Analogue Electronics
8 6 (5.13%) Life Science
9 4 (3.42%) Algorithms
9 4 (3.42%) GNSS
9 4 (3.42%) MicroBlaze
9 4 (3.42%) Self-Driving Car
9 4 (3.42%) Tandem
10 3 (2.56%) e-Learning
10 3 (2.56%) iPad
10 3 (2.56%) iPhone
10 3 (2.56%) Virtual Team
Operating Systems
1 25 (21.37%) Linux
2 18 (15.38%) Windows
3 12 (10.26%) Embedded Linux
4 8 (6.84%) Windows Server
5 7 (5.98%) FreeRTOS
6 4 (3.42%) Apple iOS
6 4 (3.42%) Red Hat Enterprise Linux
6 4 (3.42%) Unix
7 1 (0.85%) Android
7 1 (0.85%) Windows Server 2016
7 1 (0.85%) Windows Server 2019
Processes & Methodologies
1 35 (29.91%) Prototyping
2 26 (22.22%) Schematic Capture
3 21 (17.95%) Software Engineering
4 20 (17.09%) Requirements Analysis
4 20 (17.09%) Stress Analysis
5 17 (14.53%) Problem-Solving
6 15 (12.82%) Change Management
7 13 (11.11%) Software Architecture
8 12 (10.26%) Collaborative Working
8 12 (10.26%) Infrastructure Engineering
9 11 (9.40%) FPGA Design
9 11 (9.40%) Multithreading
10 9 (7.69%) CI/CD
10 9 (7.69%) Continuous Deployment
10 9 (7.69%) Continuous Integration
10 9 (7.69%) Open Source
10 9 (7.69%) Test Automation
10 9 (7.69%) Unit Testing
11 8 (6.84%) Incident Management
11 8 (6.84%) Problem Management
Programming Languages
1 46 (39.32%) C
2 32 (27.35%) C++
3 15 (12.82%) C#
4 13 (11.11%) Python
5 5 (4.27%) Java
5 5 (4.27%) MATLAB
5 5 (4.27%) PowerShell
6 4 (3.42%) Embedded C++
7 3 (2.56%) SQL
8 2 (1.71%) Assembly Language
8 2 (1.71%) Bash
8 2 (1.71%) Embedded C
9 1 (0.85%) VBScript
Qualifications
1 36 (30.77%) Degree
2 11 (9.40%) Security Cleared
3 8 (6.84%) SC Cleared
4 6 (5.13%) CCNP
4 6 (5.13%) Cisco Certification
5 5 (4.27%) CCNA
6 3 (2.56%) DV Cleared
6 3 (2.56%) MCSA
6 3 (2.56%) Microsoft Certification
7 2 (1.71%) Master's Degree
7 2 (1.71%) MCP
7 2 (1.71%) VMware Certified Professional (VCP)
8 1 (0.85%) DBS Check
8 1 (0.85%) MCITP
8 1 (0.85%) PhD
Quality Assurance & Compliance
1 5 (4.27%) Accessibility
1 5 (4.27%) QA
2 3 (2.56%) JTAG
3 1 (0.85%) AUTOSAR
3 1 (0.85%) DO-254
3 1 (0.85%) ISO 26262
3 1 (0.85%) MISRA
3 1 (0.85%) MISRA C
System Software
1 48 (41.03%) Embedded Firmware
2 9 (7.69%) Active Directory
3 5 (4.27%) BitLocker
4 4 (3.42%) VMware ESXi
5 3 (2.56%) VMware Infrastructure
6 2 (1.71%) EMC RecoverPoint
6 2 (1.71%) Virtual Machines
6 2 (1.71%) VMware NSX
6 2 (1.71%) vSphere
7 1 (0.85%) Hyper-V
7 1 (0.85%) Virtual Servers
Systems Management
1 5 (4.27%) SCCM
2 3 (2.56%) Dell DRAC
3 2 (1.71%) Ansible
3 2 (1.71%) Failover Clustering
3 2 (1.71%) vCenter Server
3 2 (1.71%) vRealize
3 2 (1.71%) VxRail
3 2 (1.71%) WSUS
4 1 (0.85%) FortiGate
Vendors
1 19 (16.24%) Microsoft
2 16 (13.68%) Cisco
3 12 (10.26%) Meraki
3 12 (10.26%) SolarWinds
4 11 (9.40%) CheckPoint
4 11 (9.40%) Fortinet
5 8 (6.84%) EMC
6 7 (5.98%) Infoblox
6 7 (5.98%) VMware
7 5 (4.27%) Apple
7 5 (4.27%) Cadence
7 5 (4.27%) HP
7 5 (4.27%) MobileIron
7 5 (4.27%) Xilinx
8 4 (3.42%) McAfee
9 3 (2.56%) Dell
9 3 (2.56%) Dynatrace
9 3 (2.56%) Zscaler
10 2 (1.71%) OneLogin
10 2 (1.71%) Palo Alto