Observability Jobs with Work from Home Options

Observability
UK > Work from Home

The table below provides summary statistics for permanent job vacancies with an option to work from home (WFH) and a requirement for Observability skills. Included is a benchmarking guide to the salaries offered in vacancies that have cited Observability over the 6 months to 11 May 2024 with a comparison to the same period in the previous 2 years.

6 months to
11 May 2024
Same period 2023 Same period 2022
Rank 495 490 394
Rank change year-on-year -5 -96 +96
Permanent jobs citing Observability 90 183 591
As % of all permanent jobs with a WFH option 0.27% 0.44% 0.86%
As % of the Processes & Methodologies category 0.29% 0.46% 0.89%
Number of salaries quoted 79 142 135
10th Percentile £50,000 £42,874 £54,549
25th Percentile £63,000 £57,500 £58,374
Median annual salary (50th Percentile) £75,000 £77,500 £85,000
Median % change year-on-year -3.23% -8.82% +25.93%
75th Percentile £99,342 £90,000 £111,250
90th Percentile £111,250 £100,000 £114,500
UK median annual salary £80,000 £80,000 £80,000

All Process and Methodology Skills
Work from Home

Observability is in the Processes and Methodologies category. The following table is for comparison with the above and provides summary statistics for all permanent job vacancies with a WFH option and a requirement for process or methodology skills.

Permanent vacancies with a requirement for process or methodology skills 30,884 39,545 66,696
As % of all permanent jobs with a WFH option 91.37% 96.08% 96.99%
Number of salaries quoted 23,455 27,516 41,159
10th Percentile £33,750 £37,500 £36,250
25th Percentile £42,500 £47,500 £45,750
Median annual salary (50th Percentile) £57,500 £62,500 £60,000
Median % change year-on-year -8.00% +4.17% +9.09%
75th Percentile £75,000 £82,500 £80,000
90th Percentile £95,000 £100,000 £95,000
UK median annual salary £55,000 £61,000 £60,000
% change year-on-year -9.84% +1.67% +9.09%

Observability
Trend for Jobs with a WFH Option

Job vacancies with a work from home option citing Observability as a proportion of all IT jobs advertised.
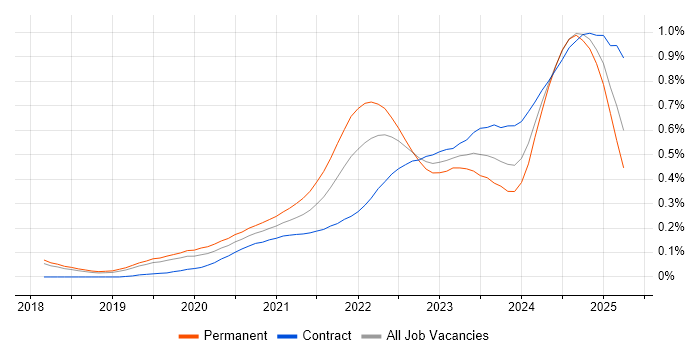
Observability trend for jobs with a WFH option

Observability
Salary Trend for Jobs with a WFH Option

3-month moving average salary quoted in job vacancies with a work from home option citing Observability.

Observability salary trend for jobs with a WFH option

Observability
Salary Histogram for Jobs with a WFH Option

Salary distribution for jobs with a work from home option citing Observability over the 6 months to 11 May 2024.

Observability salary histogram for jobs with a WFH option

Observability
Co-occurring Skills and Capabilities with WFH Options by Category

The follow tables expand on the table above by listing co-occurrences grouped by category. The same employment type, locality and period is covered with up to 20 co-occurrences shown in each of the following categories:

Application Platforms
1 7 (7.78%) Apache
2 6 (6.67%) nginx
3 5 (5.56%) Apache Airflow
4 3 (3.33%) Confluence
5 2 (2.22%) Apache Spark
Cloud Services
1 57 (63.33%) AWS
2 35 (38.89%) Azure
3 20 (22.22%) GCP
4 17 (18.89%) Serverless
5 14 (15.56%) Datadog
6 12 (13.33%) Azure DevOps
6 12 (13.33%) GitHub
7 11 (12.22%) AWS Lambda
8 8 (8.89%) Amazon S3
8 8 (8.89%) OpenShift
9 7 (7.78%) Amazon ECS
9 7 (7.78%) AWS CloudFormation
9 7 (7.78%) Azure AKS
10 6 (6.67%) Amazon EC2
10 6 (6.67%) Amazon EKS
10 6 (6.67%) GitHub Actions
10 6 (6.67%) npm
10 6 (6.67%) Yarn
11 5 (5.56%) Snowflake
12 4 (4.44%) Pulumi
Communications & Networking
1 11 (12.22%) AMQP
2 8 (8.89%) Network Security
3 3 (3.33%) VPN
4 2 (2.22%) DNS
4 2 (2.22%) Firewall
Database & Business Intelligence
1 12 (13.33%) Relational Database
2 10 (11.11%) MongoDB
3 9 (10.00%) Amazon Aurora
3 9 (10.00%) Data Warehouse
3 9 (10.00%) InfluxDB
3 9 (10.00%) MySQL
4 7 (7.78%) BigQuery
4 7 (7.78%) SQL Server
5 6 (6.67%) Amazon RDS
5 6 (6.67%) Big Data
6 5 (5.56%) Data Vault
6 5 (5.56%) Looker
6 5 (5.56%) Tableau
7 4 (4.44%) Metadata
8 3 (3.33%) Power BI
9 2 (2.22%) Data Lake
9 2 (2.22%) Data Mart
9 2 (2.22%) DynamoDB
9 2 (2.22%) Oracle Database
9 2 (2.22%) Redis
Development Applications
1 14 (15.56%) Jenkins
2 8 (8.89%) GitLab
3 7 (7.78%) JIRA
4 6 (6.67%) Cypress.io
4 6 (6.67%) Git
4 6 (6.67%) Mocha
5 4 (4.44%) CircleCI
5 4 (4.44%) Sonatype Nexus
6 3 (3.33%) Bitbucket
7 2 (2.22%) Artifactory
7 2 (2.22%) Gradle
8 1 (1.11%) Gatling
8 1 (1.11%) JUnit
8 1 (1.11%) LoadRunner
8 1 (1.11%) Vagrant
General
1 20 (22.22%) Finance
2 11 (12.22%) Banking
3 9 (10.00%) Tech for Good
4 8 (8.89%) Retail
5 6 (6.67%) Social Skills
6 5 (5.56%) Analytical Skills
6 5 (5.56%) Marketing
7 1 (1.11%) Games
Job Titles
1 32 (35.56%) DevOps Engineer
1 32 (35.56%) Senior
2 10 (11.11%) Developer
2 10 (11.11%) Senior DevOps
2 10 (11.11%) Senior DevOps Engineer
3 9 (10.00%) Analyst
3 9 (10.00%) DBA
3 9 (10.00%) Senior DBA
4 8 (8.89%) AWS Engineer
5 7 (7.78%) Data Engineer
6 6 (6.67%) AWS DevOps
6 6 (6.67%) AWS DevOps Engineer
6 6 (6.67%) Azure DevOps Engineer
6 6 (6.67%) Azure Engineer
6 6 (6.67%) Backend Developer
6 6 (6.67%) Senior Backend Developer
6 6 (6.67%) Senior Developer
7 5 (5.56%) Monitoring Analyst
7 5 (5.56%) Senior Data Engineer
8 4 (4.44%) IT Engineer
Libraries, Frameworks & Software Standards
1 15 (16.67%) .NET
2 13 (14.44%) React
3 12 (13.33%) Node.js
4 11 (12.22%) RabbitMQ
5 8 (8.89%) AngularJS
6 6 (6.67%) .NET Core
6 6 (6.67%) Express.js
6 6 (6.67%) GraphQL
6 6 (6.67%) gRPC
6 6 (6.67%) Jest
6 6 (6.67%) JWT
6 6 (6.67%) Kafka
6 6 (6.67%) MEAN Stack
6 6 (6.67%) MERN Stack
6 6 (6.67%) Mongoose
6 6 (6.67%) NestJS
6 6 (6.67%) OAuth
6 6 (6.67%) OAuth2
6 6 (6.67%) OpenAPI
6 6 (6.67%) YAML
Miscellaneous
1 7 (7.78%) Linux Command Line
2 6 (6.67%) Cloud Native
2 6 (6.67%) Greenfield Project
2 6 (6.67%) Product Ownership
3 4 (4.44%) Credit Risk
4 3 (3.33%) Data Centre
4 3 (3.33%) Distributed Architecture
5 2 (2.22%) Client/Server
5 2 (2.22%) Hybrid Cloud
5 2 (2.22%) Mobile App
5 2 (2.22%) Public Cloud
5 2 (2.22%) Renewable Energy
6 1 (1.11%) Algorithms
6 1 (1.11%) Analytical Mindset
6 1 (1.11%) Distributed Systems
6 1 (1.11%) Enterprise Cloud
6 1 (1.11%) Legacy Systems
6 1 (1.11%) Video Conferencing
Operating Systems
1 13 (14.44%) Linux
2 6 (6.67%) Windows
2 6 (6.67%) Windows Server
3 1 (1.11%) Unix
Processes & Methodologies
1 50 (55.56%) DevOps
2 32 (35.56%) Agile
3 31 (34.44%) Infrastructure as Code
4 28 (31.11%) CI/CD
5 22 (24.44%) Fintech
6 20 (22.22%) Software Engineering
7 17 (18.89%) Configuration Management
7 17 (18.89%) Containerisation
8 15 (16.67%) Event-Driven
8 15 (16.67%) Platform Engineering
8 15 (16.67%) Problem-Solving
9 13 (14.44%) Data Pipeline
10 11 (12.22%) Business Intelligence
10 11 (12.22%) Microservices
11 10 (11.11%) Continuous Improvement
12 9 (10.00%) Data Engineering
12 9 (10.00%) Data Management
12 9 (10.00%) DevSecOps
12 9 (10.00%) SDLC
12 9 (10.00%) Visualisation
Programming Languages
1 32 (35.56%) Python
2 21 (23.33%) Java
3 20 (22.22%) SQL
4 13 (14.44%) PowerShell
5 12 (13.33%) Bash
5 12 (13.33%) Go
6 11 (12.22%) JavaScript
7 9 (10.00%) Kotlin
8 8 (8.89%) TypeScript
9 7 (7.78%) Shell Script
10 6 (6.67%) C#
11 4 (4.44%) Groovy
12 3 (3.33%) Ruby
12 3 (3.33%) Scala
Qualifications
1 6 (6.67%) SC Cleared
1 6 (6.67%) Security Cleared
2 4 (4.44%) Degree
3 2 (2.22%) AWS Certification
3 2 (2.22%) AWS Certified DevOps Engineer
3 2 (2.22%) AWS Certified Solutions Architect
3 2 (2.22%) Microsoft Certification
Quality Assurance & Compliance
1 10 (11.11%) Data Quality
2 7 (7.78%) ISO/IEC 27001
3 6 (6.67%) Cyber Essentials
4 1 (1.11%) Accessibility
4 1 (1.11%) ISO 9001
System Software
1 27 (30.00%) Docker
Systems Management
1 46 (51.11%) Terraform
2 43 (47.78%) Kubernetes
3 23 (25.56%) Grafana
4 21 (23.33%) Prometheus
5 11 (12.22%) Ansible
6 7 (7.78%) Progress Chef
7 5 (5.56%) Docker Swarm
7 5 (5.56%) Istio
7 5 (5.56%) Packer
8 4 (4.44%) Consul
9 3 (3.33%) Kibana
9 3 (3.33%) Puppet
10 2 (2.22%) Nagios
10 2 (2.22%) Rundeck
11 1 (1.11%) Salt
Vendors
1 11 (12.22%) Dynatrace
2 8 (8.89%) New Relic
3 7 (7.78%) Microsoft
4 6 (6.67%) PagerDuty
5 4 (4.44%) Google
5 4 (4.44%) Splunk
6 3 (3.33%) AppDynamics
7 2 (2.22%) Ab Initio
7 2 (2.22%) Databricks
7 2 (2.22%) LogicMonitor
7 2 (2.22%) Oracle
7 2 (2.22%) Palo Alto