TypeScript Jobs with Work from Home Options

Microsoft TypeScript
UK > Work from Home

The table below provides summary statistics for permanent job vacancies with an option to work from home (WFH) and a requirement for TypeScript skills. Included is a benchmarking guide to the salaries offered in vacancies that have cited TypeScript over the 6 months to 27 April 2024 with a comparison to the same period in the previous 2 years.

6 months to
27 Apr 2024
Same period 2023 Same period 2022
Rank 52 57 33
Rank change year-on-year +5 -24 +6
Permanent jobs citing TypeScript 1,661 2,272 5,912
As % of all permanent jobs with a WFH option 4.92% 5.27% 8.86%
As % of the Programming Languages category 12.09% 10.69% 15.10%
Number of salaries quoted 1,535 1,682 2,756
10th Percentile £42,500 £46,250 £42,125
25th Percentile £51,000 £53,750 £52,500
Median annual salary (50th Percentile) £70,000 £75,000 £70,000
Median % change year-on-year -6.67% +7.14% +16.67%
75th Percentile £95,000 £92,500 £87,500
90th Percentile £138,750 £116,125 £105,000
UK median annual salary £70,000 £72,500 £70,000
% change year-on-year -3.45% +3.57% +16.67%

All Programming Languages
Work from Home

TypeScript is in the Programming Languages category. The following table is for comparison with the above and provides summary statistics for all permanent job vacancies with a WFH option and a requirement for coding skills.

Permanent vacancies with a requirement for coding skills 13,739 21,246 39,163
As % of all permanent jobs with a WFH option 40.72% 49.24% 58.66%
Number of salaries quoted 11,385 15,601 23,937
10th Percentile £38,750 £41,000 £37,500
25th Percentile £46,250 £50,000 £46,250
Median annual salary (50th Percentile) £60,000 £65,000 £62,500
Median % change year-on-year -7.69% +4.00% +13.64%
75th Percentile £78,750 £85,000 £81,250
90th Percentile £100,000 £105,000 £95,000
UK median annual salary £60,000 £65,000 £62,500
% change year-on-year -7.69% +4.00% +13.64%

TypeScript
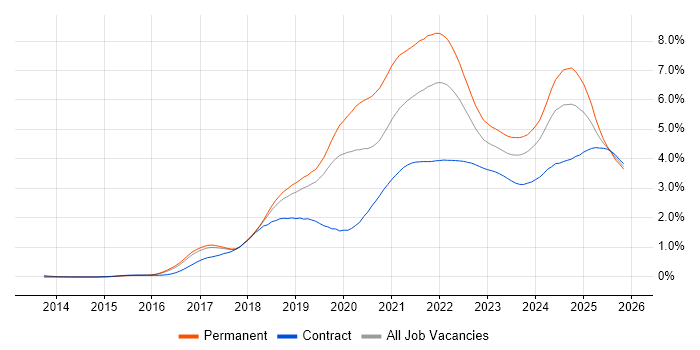
Trend for Jobs with a WFH Option

Job vacancies with a work from home option citing TypeScript as a proportion of all IT jobs advertised.

TypeScript trend for jobs with a WFH option

TypeScript
Salary Trend for Jobs with a WFH Option

3-month moving average salary quoted in job vacancies with a work from home option citing TypeScript.

TypeScript salary trend for jobs with a WFH option

TypeScript
Salary Histogram for Jobs with a WFH Option

Salary distribution for jobs with a work from home option citing TypeScript over the 6 months to 27 April 2024.

TypeScript salary histogram for jobs with a WFH option

TypeScript
Co-occurring Skills and Capabilities with WFH Options by Category

The follow tables expand on the table above by listing co-occurrences grouped by category. The same employment type, locality and period is covered with up to 20 co-occurrences shown in each of the following categories:

Application Platforms
1 195 (11.74%) Apache Airflow
2 182 (10.96%) Apache
3 29 (1.75%) IIS
4 27 (1.63%) nginx
5 23 (1.38%) CMS
6 18 (1.08%) SharePoint
7 12 (0.72%) Umbraco
8 8 (0.48%) Sitecore CMS
9 7 (0.42%) Apache Spark
9 7 (0.42%) EPiServer
9 7 (0.42%) Microsoft Exchange
10 6 (0.36%) Apache Solr
10 6 (0.36%) DNN
10 6 (0.36%) Immediacy CMS
10 6 (0.36%) Kentico
10 6 (0.36%) Sitefinity
10 6 (0.36%) WordPress
11 5 (0.30%) Confluence
12 4 (0.24%) Adobe Experience Manager
12 4 (0.24%) OpenEdge
Applications
1 14 (0.84%) Adobe XD
2 2 (0.12%) Adobe Illustrator
2 2 (0.12%) Photoshop
2 2 (0.12%) Sketch
2 2 (0.12%) S-PLUS
Business Applications
1 4 (0.24%) Dynamics CRM
1 4 (0.24%) Shopify
2 2 (0.12%) Distributed Ledger
2 2 (0.12%) R3 Corda
3 1 (0.060%) Dynamics NAV
Cloud Services
1 1,004 (60.45%) AWS
2 669 (40.28%) Azure
3 286 (17.22%) GCP
4 171 (10.30%) dbt
5 136 (8.19%) Serverless
6 132 (7.95%) Snowflake
7 120 (7.22%) Azure DevOps
8 101 (6.08%) SaaS
9 92 (5.54%) GitHub
10 75 (4.52%) AWS Lambda
11 23 (1.38%) Power Platform
12 18 (1.08%) Azure Functions
13 17 (1.02%) Amazon Kinesis
13 17 (1.02%) Amazon SQS
13 17 (1.02%) Microsoft 365
13 17 (1.02%) npm
13 17 (1.02%) PowerApps
14 16 (0.96%) Cloud Computing
14 16 (0.96%) Dynamics 365
14 16 (0.96%) Firebase
Communications & Networking
1 22 (1.32%) Internet
2 18 (1.08%) HTTP
3 16 (0.96%) Hyperconnected
4 12 (0.72%) MQTT
5 7 (0.42%) AMQP
5 7 (0.42%) OpenVPN
6 5 (0.30%) Broadband
6 5 (0.30%) Reverse Proxy
6 5 (0.30%) VPN
7 4 (0.24%) TCP/IP
8 3 (0.18%) GPRS
9 2 (0.12%) Ethernet
9 2 (0.12%) Intranet
Database & Business Intelligence
1 327 (19.69%) SQL Server
2 256 (15.41%) MongoDB
3 235 (14.15%) Elasticsearch
4 172 (10.36%) Apache Ignite
5 171 (10.30%) Amazon Athena
5 171 (10.30%) Apache Arrow
5 171 (10.30%) Dremio
6 132 (7.95%) Data Lake
7 88 (5.30%) MySQL
8 82 (4.94%) PostgreSQL
9 53 (3.19%) NoSQL
10 51 (3.07%) Redis
11 44 (2.65%) DynamoDB
12 35 (2.11%) Relational Database
13 20 (1.20%) Azure SQL Database
14 10 (0.60%) Amazon Aurora
14 10 (0.60%) DB2
15 9 (0.54%) GIS
16 8 (0.48%) Amazon RDS
16 8 (0.48%) MariaDB
Development Applications
1 165 (9.93%) Git
2 95 (5.72%) GitLab
3 52 (3.13%) Cypress.io
4 37 (2.23%) Jasmine
4 37 (2.23%) Jenkins
4 37 (2.23%) JIRA
5 29 (1.75%) Karma Test Runner
6 20 (1.20%) Visual Studio
7 18 (1.08%) webpack
8 16 (0.96%) Selenium
9 15 (0.90%) gulp
10 14 (0.84%) Cucumber
11 13 (0.78%) Team Foundation Server
12 11 (0.66%) TeamCity
13 10 (0.60%) Bitbucket
13 10 (0.60%) Storybook
13 10 (0.60%) Yeoman
14 8 (0.48%) Postman
15 7 (0.42%) Maven
15 7 (0.42%) Visual Studio Code
General
1 493 (29.68%) Finance
2 264 (15.89%) Front Office
3 171 (10.30%) Banking
4 160 (9.63%) Social Skills
5 154 (9.27%) Investment Banking
6 81 (4.88%) Retail
7 55 (3.31%) Inclusion and Diversity
8 54 (3.25%) Analytical Skills
9 49 (2.95%) Games
10 47 (2.83%) Back Office
11 39 (2.35%) Marketing
12 33 (1.99%) Manufacturing
13 28 (1.69%) Tech for Good
14 27 (1.63%) Public Sector
15 24 (1.44%) Health Technology
16 19 (1.14%) Law
17 16 (0.96%) Legal
17 16 (0.96%) Telecoms
18 12 (0.72%) Automotive
18 12 (0.72%) Electronics
Job Titles
1 1,119 (67.37%) Developer
2 459 (27.63%) Senior
3 341 (20.53%) Software Engineer
4 332 (19.99%) .NET Developer
5 278 (16.74%) Senior Developer
6 240 (14.45%) Lead
7 210 (12.64%) Full Stack Developer
8 163 (9.81%) Senior Software Engineer
9 145 (8.73%) Developer/Software Engineer
10 142 (8.55%) Front-End Developer (Client-Side Developer)
11 138 (8.31%) React Developer
12 130 (7.83%) Software Developer
13 121 (7.28%) C# Developer
14 105 (6.32%) Lead Developer
15 85 (5.12%) Senior Software Developer
16 84 (5.06%) Python Developer
17 82 (4.94%) Python Engineer
18 76 (4.58%) Technical Leader
19 75 (4.52%) C# .NET Developer
19 75 (4.52%) Full Stack Engineer
Libraries, Frameworks & Software Standards
1 967 (58.22%) React
2 607 (36.54%) Node.js
3 585 (35.22%) AngularJS
4 555 (33.41%) .NET
5 429 (25.83%) Vue
6 342 (20.59%) ASP.NET
7 336 (20.23%) .NET Core
8 319 (19.21%) CSS
9 295 (17.76%) .NET Framework
10 286 (17.22%) HTML
11 254 (15.29%) Entity Framework
12 247 (14.87%) ASP.NET Web API
13 239 (14.39%) ASP.NET MVC
14 211 (12.70%) gRPC
15 195 (11.74%) Protocol Buffers
16 176 (10.60%) Pandas
17 162 (9.75%) NumPy
17 162 (9.75%) Redux
17 162 (9.75%) SciPy
18 102 (6.14%) GraphQL
Miscellaneous
1 249 (14.99%) Fixed Income
2 214 (12.88%) Foreign Exchange (FX)
3 209 (12.58%) Derivative
3 209 (12.58%) Equities
3 209 (12.58%) Hedge funds
4 123 (7.41%) Greenfield Project
5 70 (4.21%) Private Cloud
5 70 (4.21%) Product Ownership
6 64 (3.85%) Client/Server
7 56 (3.37%) Data Structures
8 54 (3.25%) IoT
9 43 (2.59%) Algorithms
10 37 (2.23%) Mobile App
11 30 (1.81%) Cloud Native
12 25 (1.51%) Virtual Team
13 24 (1.44%) Distributed Systems
14 19 (1.14%) Enterprise Software
15 16 (0.96%) NHS
16 14 (0.84%) Low-Code
17 13 (0.78%) Online Games
Operating Systems
1 58 (3.49%) Linux
2 26 (1.57%) Android
3 25 (1.51%) Windows
4 23 (1.38%) Apple iOS
5 8 (0.48%) CentOS
5 8 (0.48%) Unix
6 6 (0.36%) Alpine Linux
6 6 (0.36%) Windows Server
7 4 (0.24%) AIX
7 4 (0.24%) Red Hat Enterprise Linux
8 1 (0.060%) Debian
8 1 (0.060%) Mac OS
8 1 (0.060%) Solaris
Processes & Methodologies
1 865 (52.08%) Agile
2 678 (40.82%) Full Stack Development
3 645 (38.83%) Software Engineering
4 413 (24.86%) Microservices
5 343 (20.65%) TDD
6 320 (19.27%) Scrum
7 291 (17.52%) Asset Management
8 274 (16.50%) Kanban
9 273 (16.44%) MVC
10 270 (16.26%) DevOps
11 245 (14.75%) BDD
12 224 (13.49%) Problem-Solving
13 223 (13.43%) Investment Management
14 218 (13.12%) Front End Development
15 192 (11.56%) CI/CD
16 148 (8.91%) User Experience
17 147 (8.85%) Fintech
18 129 (7.77%) Continuous Integration
19 120 (7.22%) Computer Science
20 117 (7.04%) Mentoring
Programming Languages
1 1,195 (71.94%) JavaScript
2 571 (34.38%) C#
3 476 (28.66%) Python
4 401 (24.14%) Java
5 272 (16.38%) SQL
6 84 (5.06%) PHP
7 48 (2.89%) Go
8 47 (2.83%) Kotlin
9 34 (2.05%) T-SQL
10 30 (1.81%) VB.NET
11 29 (1.75%) PowerShell
12 28 (1.69%) VB
12 28 (1.69%) VB6
13 26 (1.57%) Ruby
14 22 (1.32%) Scala
15 13 (0.78%) Rust
15 13 (0.78%) Shell Script
16 12 (0.72%) C++
16 12 (0.72%) Swift
17 11 (0.66%) Bash
Qualifications
1 123 (7.41%) Degree
2 70 (4.21%) Security Cleared
3 58 (3.49%) Computer Science Degree
4 31 (1.87%) SC Cleared
5 22 (1.32%) Azure Certification
6 16 (0.96%) DBS Check
7 7 (0.42%) AWS Certification
8 3 (0.18%) Microsoft Certification
8 3 (0.18%) PMI Certification
9 2 (0.12%) BPSS Clearance
9 2 (0.12%) DV Cleared
10 1 (0.060%) AWS Certified Developer
10 1 (0.060%) AWS Certified Solutions Architect
10 1 (0.060%) ISTQB
10 1 (0.060%) Master's Degree
Quality Assurance & Compliance
1 88 (5.30%) QA
2 56 (3.37%) Data Quality
3 16 (0.96%) Accessibility
4 9 (0.54%) WCAG
5 7 (0.42%) ISO/IEC 27001
6 6 (0.36%) Cyber Essentials
System Software
1 215 (12.94%) Docker
2 7 (0.42%) Firmware
3 6 (0.36%) Active Directory
Systems Management
1 140 (8.43%) Kubernetes
2 79 (4.76%) Terraform
3 14 (0.84%) Grafana
4 13 (0.78%) Prometheus
5 10 (0.60%) Ansible
6 9 (0.54%) Puppet
7 8 (0.48%) Progress Chef
8 6 (0.36%) Opsgenie
9 5 (0.30%) HP Quality Center
9 5 (0.30%) Rancher
10 4 (0.24%) Consul
10 4 (0.24%) Packer
11 2 (0.12%) CASB
11 2 (0.12%) Istio
12 1 (0.060%) Hadoop YARN
12 1 (0.060%) Plesk
12 1 (0.060%) Salt
Vendors
1 343 (20.65%) Microsoft
2 82 (4.94%) Google
3 20 (1.20%) Adobe
4 12 (0.72%) SAP
5 11 (0.66%) Oracle
6 8 (0.48%) Databricks
6 8 (0.48%) New Relic
6 8 (0.48%) Sitecore
7 7 (0.42%) NVIDIA
7 7 (0.42%) SaltStack
8 6 (0.36%) Alterian
8 6 (0.36%) OpenAI
8 6 (0.36%) Salesforce
8 6 (0.36%) Splunk
9 5 (0.30%) DevExpress
9 5 (0.30%) HP
9 5 (0.30%) Northgate
10 4 (0.24%) Apple
11 3 (0.18%) IBM
11 3 (0.18%) Sony