iPhone Jobs with Work from Home Options

Apple iPhone
UK > Work from Home

The table below looks at the prevalence of the term iPhone in remote or hybrid work. Included is a benchmarking guide to the salaries offered in vacancies that cited iPhone over the 6 months leading up to 26 July 2024, comparing them to the same period in the previous two years.

6 months to
26 Jul 2024
Same period 2023 Same period 2022
Rank 500 553 681
Rank change year-on-year +53 +128 -200
Permanent jobs citing iPhone 33 26 235
As % of all permanent jobs with a WFH option 0.12% 0.079% 0.30%
As % of the Miscellaneous category 0.34% 0.20% 0.64%
Number of salaries quoted 32 22 43
10th Percentile £27,500 £21,277 £25,650
25th Percentile £32,000 £26,044 £28,250
Median annual salary (50th Percentile) £52,500 £40,262 £36,500
Median % change year-on-year +30.40% +10.31% -35.11%
75th Percentile £71,250 £72,500 £80,000
90th Percentile £79,125 - -
UK median annual salary £45,000 £35,000 £35,250
% change year-on-year +28.57% -0.71% -31.22%

All Generic Skills
Work from Home

iPhone falls under the General and Transferable Skills category. For comparison with the information above, the following table provides summary statistics for all permanent job vacancies with remote or hybrid options requiring generic IT skills.

Permanent vacancies with a requirement for generic IT skills 9,605 12,729 36,632
As % of all permanent jobs with a WFH option 34.38% 38.79% 46.65%
Number of salaries quoted 6,855 9,924 18,426
10th Percentile £33,500 £40,000 £37,500
25th Percentile £45,000 £50,000 £47,500
Median annual salary (50th Percentile) £60,000 £65,000 £65,000
Median % change year-on-year -7.69% - +8.33%
75th Percentile £83,750 £85,000 £85,000
90th Percentile £117,500 £107,500 £100,000
UK median annual salary £55,000 £64,000 £62,500
% change year-on-year -14.06% +2.40% +4.17%

iPhone
Trend for Jobs with a WFH Option

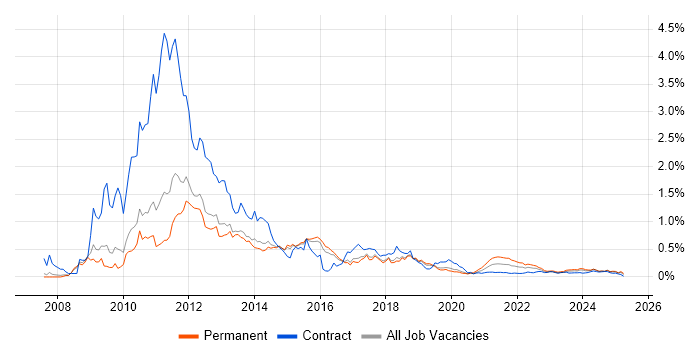
Job vacancies with a work from home option citing iPhone as a proportion of all IT jobs advertised.

iPhone trend for jobs with a WFH option

iPhone
Salary Trend for Jobs with a WFH Option

3-month moving average salary quoted in job vacancies with a work from home option citing iPhone.

iPhone salary trend for jobs with a WFH option

iPhone
Salary Histogram for Jobs with a WFH Option

Salary distribution for jobs with a work from home option citing iPhone over the 6 months to 26 July 2024.

iPhone salary histogram for jobs with a WFH option

iPhone
Co-occurring Skills and Capabilities with WFH Options by Category

The follow tables expand on the table above by listing co-occurrences grouped by category. The same employment type, locality and period is covered with up to 20 co-occurrences shown in each of the following categories:

Application Platforms
1 5 (15.15%) Microsoft Exchange
2 3 (9.09%) SharePoint
3 1 (3.03%) Confluence
Applications
1 4 (12.12%) Microsoft Office
2 1 (3.03%) 1Password
Cloud Services
1 27 (81.82%) Azure
2 12 (36.36%) Microsoft 365
3 11 (33.33%) Google Play
4 6 (18.18%) Azure Storage
4 6 (18.18%) Entra ID
5 2 (6.06%) Mimecast
5 2 (6.06%) OneDrive
6 1 (3.03%) AWS
6 1 (3.03%) IaaS
6 1 (3.03%) Microsoft Purview
6 1 (3.03%) SaaS
Communications & Networking
1 4 (12.12%) TCP/IP
2 3 (9.09%) WAN
3 2 (6.06%) DNS
4 1 (3.03%) DHCP
4 1 (3.03%) LAN
4 1 (3.03%) OpenVPN
4 1 (3.03%) Structured Cabling
4 1 (3.03%) VLAN
4 1 (3.03%) VoIP
4 1 (3.03%) VPN
4 1 (3.03%) Wi-Fi
4 1 (3.03%) Wireless
Database & Business Intelligence
1 11 (33.33%) SQL Server
2 3 (9.09%) GIS
2 3 (9.09%) QGIS
Development Applications
1 3 (9.09%) JIRA
2 1 (3.03%) Bitbucket
General
1 12 (36.36%) Social Skills
2 6 (18.18%) Presentation Skills
3 4 (12.12%) Finance
4 3 (9.09%) Legal
5 2 (6.06%) Banking
5 2 (6.06%) Law
5 2 (6.06%) Marketing
6 1 (3.03%) Financial Institution
Job Titles
1 11 (33.33%) .NET Developer
1 11 (33.33%) Developer
2 9 (27.27%) C# .NET Developer
2 9 (27.27%) C# Developer
2 9 (27.27%) Digital Developer
3 7 (21.21%) Support Engineer
4 6 (18.18%) Azure Consultant
4 6 (18.18%) Consultant
5 5 (15.15%) IT Engineer
5 5 (15.15%) IT Support
5 5 (15.15%) IT Support Engineer
6 3 (9.09%) Analyst
6 3 (9.09%) GIS Technician
6 3 (9.09%) Service Analyst
6 3 (9.09%) Service Desk Analyst
7 2 (6.06%) 3rd Line Support
7 2 (6.06%) 3rd Line Support Engineer
7 2 (6.06%) Azure Engineer
7 2 (6.06%) Microsoft 365 Engineer
7 2 (6.06%) Windows Support Engineer
Libraries, Frameworks & Software Standards
1 11 (33.33%) .NET
1 11 (33.33%) .NET Core
1 11 (33.33%) .NET Framework
1 11 (33.33%) AngularJS
1 11 (33.33%) ASP.NET
1 11 (33.33%) ASP.NET MVC
1 11 (33.33%) ASP.NET Web API
1 11 (33.33%) Entity Framework
1 11 (33.33%) Twitter Bootstrap
Miscellaneous
1 11 (33.33%) Mobile App
2 6 (18.18%) Team-Oriented Environment
3 3 (9.09%) iPad
4 2 (6.06%) Self-Motivation
4 2 (6.06%) Smartphone
5 1 (3.03%) Management Information System
5 1 (3.03%) Video Conferencing
5 1 (3.03%) Virtual Team
5 1 (3.03%) YubiKey
Operating Systems
1 15 (45.45%) Android
2 12 (36.36%) Windows
3 11 (33.33%) Windows 10
4 5 (15.15%) Apple iOS
5 3 (9.09%) Mac OS
6 1 (3.03%) Linux
6 1 (3.03%) Ubuntu
6 1 (3.03%) Windows Server 2012
Processes & Methodologies
1 11 (33.33%) Agile
1 11 (33.33%) Full Stack Development
1 11 (33.33%) Microservices
1 11 (33.33%) MVC
2 8 (24.24%) Mentoring
3 6 (18.18%) Computer Science
3 6 (18.18%) Customer Service
3 6 (18.18%) Presales
3 6 (18.18%) Problem-Solving
3 6 (18.18%) Project Delivery
3 6 (18.18%) Roadmaps
3 6 (18.18%) Value Proposition
4 3 (9.09%) CAD
4 3 (9.09%) Impact Assessments
4 3 (9.09%) ITIL
4 3 (9.09%) ITSM
4 3 (9.09%) Service Delivery
5 2 (6.06%) Asset Management
5 2 (6.06%) Coaching
5 2 (6.06%) Service Management
Programming Languages
1 11 (33.33%) C#
1 11 (33.33%) JavaScript
2 5 (15.15%) PowerShell
Qualifications
1 9 (27.27%) Degree
2 7 (21.21%) Azure Certification
3 6 (18.18%) Computer Science Degree
4 2 (6.06%) MCP
4 2 (6.06%) Microsoft Certification
5 1 (3.03%) BPSS Clearance
5 1 (3.03%) DV Cleared
5 1 (3.03%) Security Cleared
Quality Assurance & Compliance
1 2 (6.06%) SLA
System Software
1 9 (27.27%) Active Directory
2 6 (18.18%) Virtual Desktop
3 1 (3.03%) VMware Infrastructure
Systems Management
1 4 (12.12%) SCCM
2 2 (6.06%) Microsoft Intune
Vendors
1 28 (84.85%) Microsoft
2 12 (36.36%) Google
3 3 (9.09%) Apple
3 3 (9.09%) iManage
4 2 (6.06%) Citrix
4 2 (6.06%) HP
5 1 (3.03%) Atlassian
5 1 (3.03%) CA
5 1 (3.03%) Dell
5 1 (3.03%) Meraki
5 1 (3.03%) Polycom
5 1 (3.03%) Qualys
5 1 (3.03%) ServiceNow
5 1 (3.03%) Sophos
5 1 (3.03%) Sun
5 1 (3.03%) Veeam
5 1 (3.03%) VMware