Single Sign-On Jobs with Work from Home Options

Single Sign-On (SSO)
UK > Work from Home

The table below provides summary statistics for permanent remote or hybrid work requiring Single Sign-On skills. It includes a benchmarking guide to the annual salaries offered in vacancies that cited Single Sign-On over the 6 months leading up to 26 July 2024, comparing them to the same period in the previous two years.

6 months to
26 Jul 2024
Same period 2023 Same period 2022
Rank 441 474 600
Rank change year-on-year +33 +126 -72
Permanent jobs citing Single Sign-On 92 105 329
As % of all permanent jobs with a WFH option 0.33% 0.32% 0.42%
As % of the Systems Management category 2.97% 2.15% 2.07%
Number of salaries quoted 75 64 171
10th Percentile £47,500 £49,700 £46,250
25th Percentile £52,500 £57,188 £51,250
Median annual salary (50th Percentile) £70,000 £71,649 £65,000
Median % change year-on-year -2.30% +10.23% -
75th Percentile £84,919 £87,500 £87,500
90th Percentile £87,500 £96,750 £95,000
UK median annual salary £69,000 £70,000 £65,000
% change year-on-year -1.43% +7.69% +13.04%

All Systems Management Skills
Work from Home

Single Sign-On falls under the Systems Management category. For comparison with the information above, the following table provides summary statistics for all permanent job vacancies with remote or hybrid options requiring systems management skills.

Permanent vacancies with a requirement for systems management skills 3,102 4,883 15,860
As % of all permanent jobs with a WFH option 11.10% 14.88% 20.20%
Number of salaries quoted 2,163 3,893 8,081
10th Percentile £37,000 £42,500 £42,500
25th Percentile £48,500 £53,750 £50,000
Median annual salary (50th Percentile) £65,000 £70,000 £70,000
Median % change year-on-year -7.14% - +7.69%
75th Percentile £85,000 £87,500 £86,250
90th Percentile £102,500 £105,000 £100,000
UK median annual salary £62,500 £67,500 £67,500
% change year-on-year -7.41% - +3.85%

Single Sign-On
Trend for Jobs with a WFH Option

Job vacancies with a work from home option citing Single Sign-On as a proportion of all IT jobs advertised.
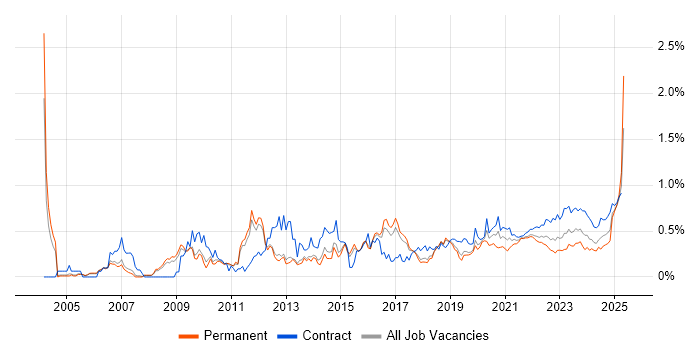
Single Sign-On trend for jobs with a WFH option

Single Sign-On
Salary Trend for Jobs with a WFH Option

3-month moving average salary quoted in job vacancies with a work from home option citing Single Sign-On.

Single Sign-On salary trend for jobs with a WFH option

Single Sign-On
Salary Histogram for Jobs with a WFH Option

Salary distribution for jobs with a work from home option citing Single Sign-On over the 6 months to 26 July 2024.

Single Sign-On salary histogram for jobs with a WFH option

Single Sign-On
Co-occurring Skills and Capabilities with WFH Options by Category

The follow tables expand on the table above by listing co-occurrences grouped by category. The same employment type, locality and period is covered with up to 20 co-occurrences shown in each of the following categories:

Application Platforms
1 14 (15.22%) Microsoft Exchange
2 4 (4.35%) Oracle Workflow
3 3 (3.26%) Apache
3 3 (3.26%) Confluence
3 3 (3.26%) GlassFish
3 3 (3.26%) JBoss
3 3 (3.26%) SharePoint
3 3 (3.26%) Tomcat
4 2 (2.17%) IIS
Applications
1 6 (6.52%) Microsoft Office
2 3 (3.26%) Microsoft Excel
3 2 (2.17%) Trello
4 1 (1.09%) MS Visio
Cloud Services
1 70 (76.09%) Azure
2 45 (48.91%) AWS
3 40 (43.48%) Entra ID
4 32 (34.78%) Microsoft 365
5 13 (14.13%) Google Workspace
6 7 (7.61%) AWS KMS
6 7 (7.61%) Azure Key Vault
6 7 (7.61%) Cloud Computing
7 6 (6.52%) GCP
8 4 (4.35%) SaaS
9 3 (3.26%) AWS CloudFormation
9 3 (3.26%) AWS CodePipeline
9 3 (3.26%) Google Compute Engine
9 3 (3.26%) Google Kubernetes Engine
9 3 (3.26%) Virtual Private Cloud
10 2 (2.17%) IaaS
10 2 (2.17%) Microsoft Purview
10 2 (2.17%) OneDrive
10 2 (2.17%) Slack
10 2 (2.17%) WhatsApp
Communications & Networking
1 26 (28.26%) DNS
2 24 (26.09%) SD-WAN
2 24 (26.09%) WAN
3 12 (13.04%) Firewall
4 9 (9.78%) Broadband
4 9 (9.78%) NAS
4 9 (9.78%) Wireless
5 5 (5.43%) TCP/IP
5 5 (5.43%) VLAN
6 3 (3.26%) BGP
6 3 (3.26%) DHCP
6 3 (3.26%) Reverse Proxy
6 3 (3.26%) VPN
7 2 (2.17%) Wi-Fi
8 1 (1.09%) Cisco IOS
8 1 (1.09%) DKIM
8 1 (1.09%) DMARC
8 1 (1.09%) Fibre Channel
8 1 (1.09%) NetScaler
8 1 (1.09%) Network Security
Database & Business Intelligence
1 5 (5.43%) Oracle Database
1 5 (5.43%) SQL Server
2 3 (3.26%) Oracle Database 12c
2 3 (3.26%) Oracle Reports
3 1 (1.09%) Amazon RDS
3 1 (1.09%) PostgreSQL
3 1 (1.09%) Power BI
3 1 (1.09%) Relational Database
Development Applications
1 15 (16.30%) JIRA
General
1 30 (32.61%) Social Skills
2 14 (15.22%) Public Sector
3 11 (11.96%) Analytical Skills
4 9 (9.78%) Games
5 8 (8.70%) Finance
6 5 (5.43%) Banking
6 5 (5.43%) Law
7 4 (4.35%) Back Office
7 4 (4.35%) Inclusion and Diversity
7 4 (4.35%) Retail
8 3 (3.26%) Financial Institution
9 1 (1.09%) Advertising
9 1 (1.09%) Automotive
9 1 (1.09%) Legal
9 1 (1.09%) Social Science
Job Titles
1 30 (32.61%) Lead
2 29 (31.52%) Architect
3 24 (26.09%) Lead Architect
3 24 (26.09%) Lead Security Architect
3 24 (26.09%) Security Architect
4 16 (17.39%) Senior
5 15 (16.30%) Infrastructure Engineer
6 11 (11.96%) Consultant
6 11 (11.96%) Identity and Access Management Engineer
6 11 (11.96%) Identity Management Engineer
7 9 (9.78%) IT Consultant
8 8 (8.70%) Senior Infrastructure Engineer
9 7 (7.61%) Infrastructure Security Engineer
9 7 (7.61%) Security Engineer
9 7 (7.61%) Senior Security Engineer
10 6 (6.52%) Azure Engineer
11 5 (5.43%) Analyst
11 5 (5.43%) Cloud Engineer
11 5 (5.43%) Infrastructure Manager
12 4 (4.35%) Support Analyst
Libraries, Frameworks & Software Standards
1 11 (11.96%) SAML
2 7 (7.61%) LDAP
2 7 (7.61%) OAuth
3 6 (6.52%) OpenID
4 4 (4.35%) SailPoint
4 4 (4.35%) Web Services
5 3 (3.26%) RESTful
6 1 (1.09%) Ajax
6 1 (1.09%) AngularJS
6 1 (1.09%) ARM Templates
6 1 (1.09%) CSS
6 1 (1.09%) HTML
6 1 (1.09%) Java EE
6 1 (1.09%) Laravel
6 1 (1.09%) React
6 1 (1.09%) Struts
Miscellaneous
1 25 (27.17%) Management Information System
2 24 (26.09%) Distributed Denial-of-Service
3 20 (21.74%) Hybrid Cloud
3 20 (21.74%) PKI
4 15 (16.30%) Onboarding
5 11 (11.96%) Enterprise Software
6 10 (10.87%) Clustering
6 10 (10.87%) Video Conferencing
7 8 (8.70%) Cloud Native
7 8 (8.70%) Public Cloud
8 7 (7.61%) Product Ownership
9 6 (6.52%) Distributed Systems
10 5 (5.43%) Linux Command Line
11 3 (3.26%) Blog
11 3 (3.26%) Data Centre
11 3 (3.26%) Legacy Applications
11 3 (3.26%) Mobile App
12 1 (1.09%) CMDB
12 1 (1.09%) Data Structures
12 1 (1.09%) Social Media
Operating Systems
1 43 (46.74%) Windows
2 36 (39.13%) Windows Server
3 12 (13.04%) Mac OS
4 6 (6.52%) Linux
5 5 (5.43%) Unix
6 4 (4.35%) Windows 10
7 3 (3.26%) AIX
7 3 (3.26%) Solaris
8 2 (2.17%) Android
8 2 (2.17%) Apple iOS
8 2 (2.17%) Windows Server 2016
8 2 (2.17%) Windows Server 2019
9 1 (1.09%) HPUX
9 1 (1.09%) Red Hat Enterprise Linux
Processes & Methodologies
1 56 (60.87%) Identity Management
2 35 (38.04%) Information Security
3 34 (36.96%) CI/CD
4 31 (33.70%) Application Security
5 29 (31.52%) Identity Access Management
6 24 (26.09%) OWASP
6 24 (26.09%) Secure Coding
6 24 (26.09%) Security Architecture
7 21 (22.83%) Mentoring
8 20 (21.74%) DevOps
9 16 (17.39%) Infrastructure Engineering
9 16 (17.39%) Multi-Factor Authentication
10 14 (15.22%) ITIL
11 13 (14.13%) Business Continuity
11 13 (14.13%) Continuous Improvement
11 13 (14.13%) Problem-Solving
12 11 (11.96%) Coaching
13 10 (10.87%) Asset Management
13 10 (10.87%) Disaster Recovery
13 10 (10.87%) Systems Engineering
Programming Languages
1 18 (19.57%) PowerShell
2 13 (14.13%) Bash
3 8 (8.70%) Java
4 7 (7.61%) Python
5 5 (5.43%) SQL
6 4 (4.35%) JavaScript
7 3 (3.26%) Go
8 1 (1.09%) Rust
Qualifications
1 27 (29.35%) AWS Certification
2 25 (27.17%) Azure Certification
3 24 (26.09%) (ISC)2 CCSP
3 24 (26.09%) CCSK
3 24 (26.09%) CCSP
3 24 (26.09%) Cisco Certification
3 24 (26.09%) CISM
3 24 (26.09%) CISSP
4 8 (8.70%) Degree
5 4 (4.35%) Security Cleared
6 2 (2.17%) VMware Certified Professional (VCP)
7 1 (1.09%) Computer Science Degree
7 1 (1.09%) MCSA
7 1 (1.09%) MCSE
7 1 (1.09%) Microsoft Certification
7 1 (1.09%) Microsoft Certified Architect
7 1 (1.09%) SC Cleared
Quality Assurance & Compliance
1 26 (28.26%) NIST
2 14 (15.22%) ISO/IEC 27001
3 12 (13.04%) Cyber Essentials
3 12 (13.04%) SOC 2
4 4 (4.35%) PCI DSS
5 1 (1.09%) GDPR
5 1 (1.09%) GRC
5 1 (1.09%) HIPAA
5 1 (1.09%) ISO/IEC 27002 (supersedes ISO/IEC 17799)
5 1 (1.09%) PMO
5 1 (1.09%) Sarbanes-Oxley
System Software
1 51 (55.43%) Active Directory
2 31 (33.70%) Docker
3 18 (19.57%) VMware Infrastructure
4 11 (11.96%) VMware ESXi
5 7 (7.61%) Hyper-V
6 1 (1.09%) Firmware
6 1 (1.09%) Terminal Services
6 1 (1.09%) Virtual Machines
6 1 (1.09%) vSphere
Systems Management
1 31 (33.70%) Kubernetes
2 13 (14.13%) Microsoft Intune
3 11 (11.96%) vCenter Server
4 9 (9.78%) Microsoft Clustering
5 7 (7.61%) CA Single Sign-On
5 7 (7.61%) Terraform
6 4 (4.35%) Active Directory Federation Services
7 3 (3.26%) NetIQ Identity Manager
7 3 (3.26%) Oracle Statspack
8 2 (2.17%) Jamf Pro
8 2 (2.17%) SCCM
9 1 (1.09%) Cisco CUCM
9 1 (1.09%) PowerCLI
9 1 (1.09%) SCOM
9 1 (1.09%) SCOrch
9 1 (1.09%) vRealize
9 1 (1.09%) vRealize Orchestrator
Vendors
1 35 (38.04%) Microsoft
2 28 (30.43%) VMware
3 26 (28.26%) ServiceNow
4 16 (17.39%) Google
5 12 (13.04%) CyberArk
6 11 (11.96%) Apple
7 9 (9.78%) Commvault
7 9 (9.78%) Oracle
7 9 (9.78%) Sun
8 7 (7.61%) CA
9 4 (4.35%) ForgeRock
10 3 (3.26%) NetIQ
10 3 (3.26%) New Relic
10 3 (3.26%) NGA Human Resources
10 3 (3.26%) Northgate
10 3 (3.26%) SolarWinds
11 2 (2.17%) Citrix
11 2 (2.17%) HP
11 2 (2.17%) SAP
12 1 (1.09%) Cisco