Video Conferencing Jobs with Work from Home Options

Videoconferencing
UK > Work from Home

The table below looks at the prevalence of the term Video Conferencing in remote or hybrid work. Included is a benchmarking guide to the salaries offered in vacancies that cited Video Conferencing over the 6 months leading up to 26 July 2024, comparing them to the same period in the previous two years.

6 months to
26 Jul 2024
Same period 2023 Same period 2022
Rank 481 516 672
Rank change year-on-year +35 +156 -140
Permanent jobs citing Video Conferencing 52 63 244
As % of all permanent jobs with a WFH option 0.19% 0.19% 0.31%
As % of the Miscellaneous category 0.54% 0.49% 0.67%
Number of salaries quoted 44 54 104
10th Percentile £28,000 £34,000 £30,500
25th Percentile £34,813 £34,750 £34,688
Median annual salary (50th Percentile) £45,000 £45,000 £42,500
Median % change year-on-year - +5.88% -34.62%
75th Percentile £52,500 £57,500 £67,813
90th Percentile £64,714 £73,750 £85,500
UK median annual salary £32,500 £37,000 £39,500
% change year-on-year -12.16% -6.33% -12.22%

All Generic Skills
Work from Home

Video Conferencing falls under the General and Transferable Skills category. For comparison with the information above, the following table provides summary statistics for all permanent job vacancies with remote or hybrid options requiring generic IT skills.

Permanent vacancies with a requirement for generic IT skills 9,605 12,729 36,632
As % of all permanent jobs with a WFH option 34.38% 38.79% 46.65%
Number of salaries quoted 6,855 9,924 18,426
10th Percentile £33,500 £40,000 £37,500
25th Percentile £45,000 £50,000 £47,500
Median annual salary (50th Percentile) £60,000 £65,000 £65,000
Median % change year-on-year -7.69% - +8.33%
75th Percentile £83,750 £85,000 £85,000
90th Percentile £117,500 £107,500 £100,000
UK median annual salary £55,000 £64,000 £62,500
% change year-on-year -14.06% +2.40% +4.17%

Video Conferencing
Trend for Jobs with a WFH Option

Job vacancies with a work from home option citing Video Conferencing as a proportion of all IT jobs advertised.
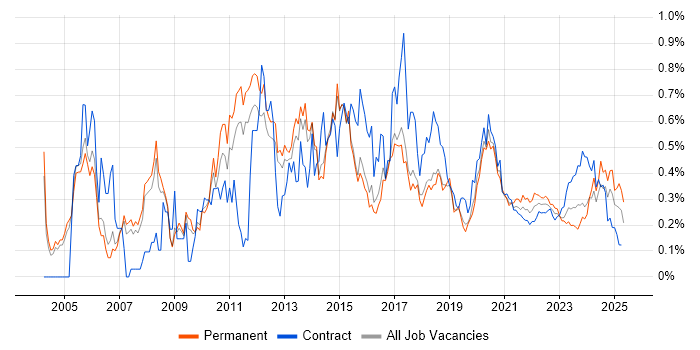
Video Conferencing trend for jobs with a WFH option

Video Conferencing
Salary Trend for Jobs with a WFH Option

3-month moving average salary quoted in job vacancies with a work from home option citing Video Conferencing.

Video Conferencing salary trend for jobs with a WFH option

Video Conferencing
Salary Histogram for Jobs with a WFH Option

Salary distribution for jobs with a work from home option citing Video Conferencing over the 6 months to 26 July 2024.

Video Conferencing salary histogram for jobs with a WFH option

Video Conferencing
Co-occurring Skills and Capabilities with WFH Options by Category

The follow tables expand on the table above by listing co-occurrences grouped by category. The same employment type, locality and period is covered with up to 20 co-occurrences shown in each of the following categories:

Application Platforms
1 8 (15.38%) Microsoft Exchange
Applications
1 11 (21.15%) Microsoft Office
Business Applications
1 3 (5.77%) Carpe Diem
Cloud Services
1 29 (55.77%) Microsoft 365
2 15 (28.85%) Azure
3 9 (17.31%) Google Workspace
4 8 (15.38%) Azure Sentinel
5 6 (11.54%) SaaS
6 5 (9.62%) AWS
7 3 (5.77%) GCP
7 3 (5.77%) Mimecast
7 3 (5.77%) Rubrik
8 2 (3.85%) Entra ID
8 2 (3.85%) IaaS
8 2 (3.85%) PaaS
Communications & Networking
1 19 (36.54%) Firewall
2 13 (25.00%) VPN
3 12 (23.08%) DNS
4 9 (17.31%) Broadband
4 9 (17.31%) NAS
4 9 (17.31%) WAN
4 9 (17.31%) Wireless
5 8 (15.38%) VoIP
6 6 (11.54%) Unified Communications
7 3 (5.77%) DHCP
7 3 (5.77%) Internet
7 3 (5.77%) LAN
7 3 (5.77%) MPLS
7 3 (5.77%) SD-WAN
7 3 (5.77%) Skype
8 2 (3.85%) Wi-Fi
9 1 (1.92%) Cisco IOS
9 1 (1.92%) Structured Cabling
9 1 (1.92%) TCP/IP
9 1 (1.92%) VLAN
Database & Business Intelligence
1 6 (11.54%) Data Warehouse
2 3 (5.77%) BusinessObjects
2 3 (5.77%) BusinessObjects Web Intelligence
2 3 (5.77%) SAP Data Services
2 3 (5.77%) SQL Server
2 3 (5.77%) SQL Server Integration Services
2 3 (5.77%) Star Schema
3 1 (1.92%) Elasticsearch
3 1 (1.92%) NoSQL
General
1 20 (38.46%) Social Skills
2 10 (19.23%) Analytical Skills
2 10 (19.23%) Games
3 7 (13.46%) Telecoms
4 6 (11.54%) Finance
4 6 (11.54%) Law
5 4 (7.69%) Marketing
6 3 (5.77%) Legal
7 2 (3.85%) Billing
8 1 (1.92%) Electronics
8 1 (1.92%) Manufacturing
8 1 (1.92%) Multimedia
8 1 (1.92%) Organisational Skills
8 1 (1.92%) Public Sector
Job Titles
1 13 (25.00%) Analyst
2 10 (19.23%) Support Analyst
3 9 (17.31%) Consultant
3 9 (17.31%) IT Consultant
4 6 (11.54%) IT Analyst
4 6 (11.54%) IT Support
5 5 (9.62%) Infrastructure Analyst
5 5 (9.62%) IT Support Analyst
5 5 (9.62%) IT Technician
6 4 (7.69%) 3rd Line Support
6 4 (7.69%) Desktop Support
6 4 (7.69%) Infrastructure Technician
6 4 (7.69%) Support Engineer
7 3 (5.77%) 3rd Line Support Analyst
7 3 (5.77%) Architect
7 3 (5.77%) Citrix Support Analyst
7 3 (5.77%) Developer
7 3 (5.77%) Development Manager
7 3 (5.77%) IT Manager
7 3 (5.77%) Technical Architect
Libraries, Frameworks & Software Standards
1 1 (1.92%) RESTful
1 1 (1.92%) Spring
1 1 (1.92%) Spring Boot
1 1 (1.92%) XMPP
Miscellaneous
1 10 (19.23%) Onboarding
2 6 (11.54%) Blackberry
3 3 (5.77%) Blog
3 3 (5.77%) e-Learning
3 3 (5.77%) Handset
3 3 (5.77%) Team-Oriented Environment
4 2 (3.85%) Fat Client
4 2 (3.85%) Thin Client
5 1 (1.92%) Cloud Native
5 1 (1.92%) Data Structures
5 1 (1.92%) Distributed Systems
5 1 (1.92%) Hedge funds
5 1 (1.92%) iPhone
5 1 (1.92%) Legacy Systems
5 1 (1.92%) Linux Command Line
5 1 (1.92%) Replication
Operating Systems
1 31 (59.62%) Windows
2 21 (40.38%) Windows Server
3 13 (25.00%) Windows 10
4 9 (17.31%) Mac OS
4 9 (17.31%) Windows Server 2019
5 4 (7.69%) Apple iOS
5 4 (7.69%) Linux
6 3 (5.77%) Windows Server 2016
7 2 (3.85%) Android
8 1 (1.92%) CentOS
8 1 (1.92%) Debian
8 1 (1.92%) Fedora
8 1 (1.92%) openSUSE
8 1 (1.92%) Ubuntu
Processes & Methodologies
1 18 (34.62%) Problem-Solving
2 17 (32.69%) Cybersecurity
3 15 (28.85%) Mobile Device Management
4 12 (23.08%) Asset Management
5 10 (19.23%) Identity Management
6 9 (17.31%) Business Continuity
6 9 (17.31%) Data Protection
6 9 (17.31%) Infrastructure Engineering
6 9 (17.31%) IT Audit
6 9 (17.31%) Penetration Testing
6 9 (17.31%) Vulnerability Scanning
7 8 (15.38%) Customer Service
8 7 (13.46%) Business Intelligence
9 6 (11.54%) Antivirus Management
9 6 (11.54%) Computer Science
9 6 (11.54%) ETL
9 6 (11.54%) Kalman Filter
9 6 (11.54%) Patch Management
9 6 (11.54%) Virtual Environments
9 6 (11.54%) Web Filtering
Programming Languages
1 10 (19.23%) Bash
2 9 (17.31%) SQL
3 1 (1.92%) C++
3 1 (1.92%) Java
3 1 (1.92%) Kotlin
3 1 (1.92%) Objective-C
3 1 (1.92%) PowerShell
3 1 (1.92%) Python
3 1 (1.92%) R
Qualifications
1 11 (21.15%) Degree
1 11 (21.15%) Microsoft Certification
2 9 (17.31%) SC Cleared
2 9 (17.31%) Security Cleared
3 6 (11.54%) DV Cleared
3 6 (11.54%) HND
4 3 (5.77%) Azure Certification
5 1 (1.92%) Computer Science Degree
Quality Assurance & Compliance
1 11 (21.15%) Cyber Essentials
1 11 (21.15%) ISO/IEC 27001
2 9 (17.31%) SOC 2
3 6 (11.54%) Data Quality
4 3 (5.77%) QA
5 2 (3.85%) Cyber Essentials PLUS
6 1 (1.92%) Accessibility
System Software
1 25 (48.08%) Active Directory
2 24 (46.15%) VMware Infrastructure
3 2 (3.85%) Terminal Services
4 1 (1.92%) Samba
Systems Management
1 10 (19.23%) Single Sign-On
2 6 (11.54%) Microsoft Intune
3 3 (5.77%) AirWatch
3 3 (5.77%) SCCM
3 3 (5.77%) ZENworks
4 2 (3.85%) Norton AntiVirus
5 1 (1.92%) Autotask
5 1 (1.92%) Cisco CUCM
5 1 (1.92%) Grafana
5 1 (1.92%) Prometheus
Vendors
1 34 (65.38%) Microsoft
2 24 (46.15%) VMware
3 9 (17.31%) Apple
3 9 (17.31%) Google
3 9 (17.31%) Mitel
3 9 (17.31%) Veeam
4 6 (11.54%) Citrix
4 6 (11.54%) McAfee
5 5 (9.62%) Cisco
6 4 (7.69%) iManage
6 4 (7.69%) SAP
7 3 (5.77%) Acronis
7 3 (5.77%) Aruba
7 3 (5.77%) Commvault
7 3 (5.77%) Dell
7 3 (5.77%) HP
7 3 (5.77%) Kaspersky
7 3 (5.77%) Oracle
7 3 (5.77%) Sophos
7 3 (5.77%) Veritas