Incident Management Jobs with Work from Home Options

Incident Management
UK > Work from Home

The table below provides summary statistics for permanent remote or hybrid work requiring Incident Management skills. It includes a benchmarking guide to the annual salaries offered in vacancies that cited Incident Management over the 6 months leading up to 26 July 2024, comparing them to the same period in the previous two years.

6 months to
26 Jul 2024
Same period 2023 Same period 2022
Rank 223 255 309
Rank change year-on-year +32 +54 +58
Permanent jobs citing Incident Management 394 418 937
As % of all permanent jobs with a WFH option 1.41% 1.27% 1.19%
As % of the Processes & Methodologies category 1.59% 1.33% 1.23%
Number of salaries quoted 268 309 743
10th Percentile £30,000 £34,456 £30,000
25th Percentile £38,793 £42,500 £39,510
Median annual salary (50th Percentile) £55,000 £60,000 £50,000
Median % change year-on-year -8.33% +20.00% -
75th Percentile £70,625 £75,000 £63,875
90th Percentile £85,750 £87,500 £78,750
UK median annual salary £52,084 £54,882 £50,000
% change year-on-year -5.10% +9.76% -

All Process and Methodology Skills
Work from Home

Incident Management falls under the Processes and Methodologies category. For comparison with the information above, the following table provides summary statistics for all permanent job vacancies with remote or hybrid options requiring process or methodology skills.

Permanent vacancies with a requirement for process or methodology skills 24,720 31,469 76,283
As % of all permanent jobs with a WFH option 88.48% 95.89% 97.14%
Number of salaries quoted 17,624 23,346 43,834
10th Percentile £35,000 £37,500 £36,250
25th Percentile £42,500 £47,500 £46,250
Median annual salary (50th Percentile) £57,965 £62,500 £60,000
Median % change year-on-year -7.26% +4.17% +9.09%
75th Percentile £77,500 £81,250 £80,000
90th Percentile £96,250 £100,000 £95,000
UK median annual salary £55,000 £60,000 £60,000
% change year-on-year -8.33% - +9.09%

Incident Management
Trend for Jobs with a WFH Option

Job vacancies with a work from home option citing Incident Management as a proportion of all IT jobs advertised.
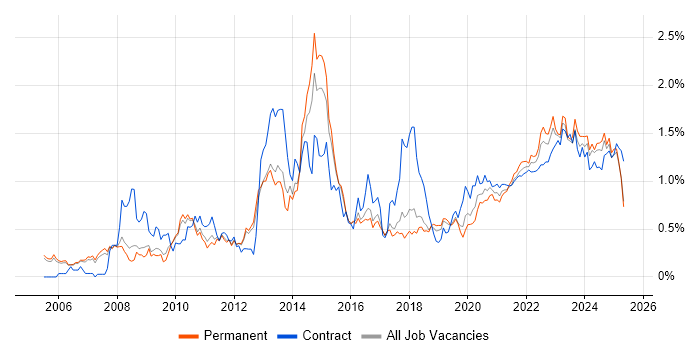
Incident Management trend for jobs with a WFH option

Incident Management
Salary Trend for Jobs with a WFH Option

3-month moving average salary quoted in job vacancies with a work from home option citing Incident Management.

Incident Management salary trend for jobs with a WFH option

Incident Management
Salary Histogram for Jobs with a WFH Option

Salary distribution for jobs with a work from home option citing Incident Management over the 6 months to 26 July 2024.

Incident Management salary histogram for jobs with a WFH option

Incident Management
Co-occurring Skills and Capabilities with WFH Options by Category

The follow tables expand on the table above by listing co-occurrences grouped by category. The same employment type, locality and period is covered with up to 20 co-occurrences shown in each of the following categories:

Application Platforms
1 22 (5.58%) SAS
2 17 (4.31%) SharePoint
3 9 (2.28%) Microsoft Exchange
4 4 (1.02%) IIS
5 3 (0.76%) Confluence
5 3 (0.76%) Exchange Server 2013
5 3 (0.76%) nginx
5 3 (0.76%) WordPress
6 2 (0.51%) CMS
6 2 (0.51%) SharePoint Server
Applications
1 24 (6.09%) Microsoft Office
2 8 (2.03%) Microsoft Excel
3 2 (0.51%) Adobe Creative Suite
4 1 (0.25%) MS Visio
Business Applications
1 14 (3.55%) Remedy ITSM
2 5 (1.27%) Oracle ERP
3 4 (1.02%) Dynamics CRM
4 3 (0.76%) NEC Housing
4 3 (0.76%) SAP S/4HANA
5 2 (0.51%) iTrent
5 2 (0.51%) NetSuite
5 2 (0.51%) SAP HCM
5 2 (0.51%) SAP MM
6 1 (0.25%) Dynamics NAV
6 1 (0.25%) Oracle EBS
Cloud Services
1 107 (27.16%) Azure
2 66 (16.75%) Microsoft 365
3 24 (6.09%) AWS
4 20 (5.08%) Entra ID
5 16 (4.06%) SaaS
6 14 (3.55%) Power Platform
6 14 (3.55%) Serverless
7 13 (3.30%) Azure Monitor
8 12 (3.05%) Azure Storage
9 10 (2.54%) Azure Data Factory
9 10 (2.54%) Azure Functions
9 10 (2.54%) Azure Logic Apps
9 10 (2.54%) Azure Service Bus
10 9 (2.28%) Azure DevOps
10 9 (2.28%) Azure Sentinel
10 9 (2.28%) PaaS
11 7 (1.78%) Amazon EC2
11 7 (1.78%) AWS CloudFormation
11 7 (1.78%) GCP
11 7 (1.78%) Virtual Private Cloud
Communications & Networking
1 40 (10.15%) Firewall
2 23 (5.84%) SAN
3 16 (4.06%) TCP/IP
3 16 (4.06%) WAN
4 14 (3.55%) DNS
4 14 (3.55%) LAN
5 9 (2.28%) Wi-Fi
6 8 (2.03%) Skype
7 7 (1.78%) DHCP
7 7 (1.78%) Network Security
7 7 (1.78%) SD-WAN
8 6 (1.52%) NAS
8 6 (1.52%) VoIP
8 6 (1.52%) Wireless
8 6 (1.52%) WLAN
9 5 (1.27%) 5G
9 5 (1.27%) Internet
9 5 (1.27%) MPLS
9 5 (1.27%) Remote Desktop
9 5 (1.27%) VPN
Database & Business Intelligence
1 26 (6.60%) SQL Server
2 19 (4.82%) MySQL
3 17 (4.31%) Relational Database
4 16 (4.06%) RDBMS
5 12 (3.05%) Amazon RDS
6 7 (1.78%) Azure SQL Database
6 7 (1.78%) Oracle Database
7 6 (1.52%) Power BI
8 5 (1.27%) PostgreSQL
9 4 (1.02%) Redis
10 3 (0.76%) MongoDB
10 3 (0.76%) SAP HANA
10 3 (0.76%) SQL Server Integration Services
11 1 (0.25%) BusinessObjects XI
11 1 (0.25%) QlikView
Development Applications
1 12 (3.05%) JIRA
2 7 (1.78%) GitLab
3 4 (1.02%) Burp Suite
3 4 (1.02%) Metasploit
3 4 (1.02%) Postman
3 4 (1.02%) sqlmap
4 3 (0.76%) Git
5 2 (0.51%) HP UFT
5 2 (0.51%) JMeter
5 2 (0.51%) LoadRunner
5 2 (0.51%) MSTest
5 2 (0.51%) Selenium
5 2 (0.51%) Team Foundation Server
General
1 152 (38.58%) Social Skills
2 76 (19.29%) Analytical Skills
3 57 (14.47%) Finance
4 31 (7.87%) Law
5 28 (7.11%) Organisational Skills
6 23 (5.84%) Legal
7 18 (4.57%) Public Sector
8 13 (3.30%) Inclusion and Diversity
8 13 (3.30%) Military
9 12 (3.05%) Front Office
10 9 (2.28%) Advertising
10 9 (2.28%) Documentation Skills
11 8 (2.03%) Back Office
11 8 (2.03%) Banking
12 7 (1.78%) Marketing
13 6 (1.52%) Retail
14 5 (1.27%) Financial Institution
15 4 (1.02%) Manufacturing
16 3 (0.76%) Aerospace
16 3 (0.76%) Japanese Language
Job Titles
1 101 (25.63%) Analyst
2 40 (10.15%) Support Analyst
3 34 (8.63%) IT Support
4 32 (8.12%) Developer
5 31 (7.87%) Security Analyst
6 29 (7.36%) Consultant
6 29 (7.36%) Support Engineer
7 28 (7.11%) Security Consultant
8 24 (6.09%) IT Engineer
9 23 (5.84%) Applications Support
10 22 (5.58%) Cybersecurity Consultant
10 22 (5.58%) IT Manager
10 22 (5.58%) ServiceNow Developer
11 20 (5.08%) 3rd Line Engineer
12 19 (4.82%) DBA
12 19 (4.82%) Information Analyst
12 19 (4.82%) Information Security Analyst
12 19 (4.82%) IT Support Engineer
12 19 (4.82%) Senior
12 19 (4.82%) Service Manager
Libraries, Frameworks & Software Standards
1 28 (7.11%) CSS
2 26 (6.60%) HTML
3 22 (5.58%) AngularJS
3 22 (5.58%) Twitter Bootstrap
3 22 (5.58%) Web Services
4 21 (5.33%) .NET
5 12 (3.05%) FIX Protocol
6 8 (2.03%) .NET Framework
7 6 (1.52%) Oracle Fusion
8 4 (1.02%) Node.js
8 4 (1.02%) WebdriverIO
9 3 (0.76%) ASP.NET
9 3 (0.76%) SailPoint
9 3 (0.76%) Software Packaging
9 3 (0.76%) YAML
10 2 (0.51%) EDI
10 2 (0.51%) Middleware
11 1 (0.25%) JSON
11 1 (0.25%) LDAP
11 1 (0.25%) XML
Miscellaneous
1 36 (9.14%) Management Information System
2 28 (7.11%) CMDB
3 22 (5.58%) Driving Licence
3 22 (5.58%) Legacy Systems
4 20 (5.08%) Enterprise Storage
5 15 (3.81%) Onboarding
5 15 (3.81%) Public Cloud
5 15 (3.81%) Self-Motivation
6 13 (3.30%) Cyber Threat
7 12 (3.05%) Linux Command Line
8 9 (2.28%) Data Centre
8 9 (2.28%) Data Protection Act
8 9 (2.28%) Security Operations Centre
8 9 (2.28%) Security Posture
9 7 (1.78%) Analytical Mindset
10 6 (1.52%) Housing Association
10 6 (1.52%) PKI
11 5 (1.27%) Fat Client
11 5 (1.27%) Mobile App
11 5 (1.27%) Thin Client
Operating Systems
1 109 (27.66%) Windows
2 64 (16.24%) Linux
3 33 (8.38%) Unix
4 30 (7.61%) Windows Server
5 10 (2.54%) Mac OS X
6 9 (2.28%) Apple iOS
7 7 (1.78%) Windows Server 2012
8 6 (1.52%) Windows 10
8 6 (1.52%) Windows Server 2016
9 4 (1.02%) Android
9 4 (1.02%) Windows Server 2019
10 3 (0.76%) Amazon Linux
10 3 (0.76%) Windows Server 2008
11 1 (0.25%) Solaris
11 1 (0.25%) Ubuntu
11 1 (0.25%) VMS
Processes & Methodologies
1 123 (31.22%) ITIL
2 105 (26.65%) Change Management
3 90 (22.84%) Service Management
4 78 (19.80%) Continuous Improvement
4 78 (19.80%) Problem Management
5 76 (19.29%) Security Operations
6 75 (19.04%) Incident Response
6 75 (19.04%) Problem-Solving
7 74 (18.78%) Cybersecurity
7 74 (18.78%) ITSM
8 67 (17.01%) Information Security
9 62 (15.74%) Customer Service
10 57 (14.47%) Service Delivery
11 53 (13.45%) Risk Management
12 45 (11.42%) Actionable Insight
12 45 (11.42%) Root Cause Analysis
13 39 (9.90%) DevOps
14 36 (9.14%) Agile
15 35 (8.88%) Infrastructure Engineering
15 35 (8.88%) Major Incident Management
Programming Languages
1 53 (13.45%) SQL
2 45 (11.42%) PowerShell
3 21 (5.33%) Bash
4 16 (4.06%) C#
5 14 (3.55%) JavaScript
6 12 (3.05%) Python
7 8 (2.03%) MATLAB
7 8 (2.03%) VB.NET
7 8 (2.03%) VBA
8 6 (1.52%) Java
9 3 (0.76%) PL/SQL
9 3 (0.76%) T-SQL
10 2 (0.51%) Kusto Query Language
11 1 (0.25%) Rust
11 1 (0.25%) VB
Qualifications
1 58 (14.72%) Security Cleared
2 50 (12.69%) Degree
3 35 (8.88%) SC Cleared
4 30 (7.61%) CISSP
5 28 (7.11%) CISM
6 23 (5.84%) Azure Certification
7 20 (5.08%) CISA
7 20 (5.08%) ITIL Certification
8 18 (4.57%) Microsoft Certification
9 11 (2.79%) Computer Science Degree
10 9 (2.28%) ISO 27001 Lead Auditor
11 7 (1.78%) CCNA
11 7 (1.78%) Cisco Certification
11 7 (1.78%) GCIH
12 5 (1.27%) AWS Certification
12 5 (1.27%) DV Cleared
12 5 (1.27%) GCIA
12 5 (1.27%) GREM
13 4 (1.02%) BPSS Clearance
14 3 (0.76%) ITIL Foundation Certificate
Quality Assurance & Compliance
1 57 (14.47%) ISO/IEC 27001
2 29 (7.36%) Cyber Essentials
3 25 (6.35%) NIST
4 24 (6.09%) SLA
5 21 (5.33%) GDPR
6 20 (5.08%) JSP 440
7 19 (4.82%) GRC
8 6 (1.52%) Cyber Essentials PLUS
9 5 (1.27%) ISO/IEC 27002 (supersedes ISO/IEC 17799)
9 5 (1.27%) PCI DSS
9 5 (1.27%) QA
10 4 (1.02%) California Consumer Privacy Act
10 4 (1.02%) ISO 22301
10 4 (1.02%) SOC 2
11 3 (0.76%) NCSC
12 2 (0.51%) Accessibility
13 1 (0.25%) COBIT
13 1 (0.25%) HIPAA
13 1 (0.25%) HMG Security Policy Framework
13 1 (0.25%) NIST 800
System Software
1 72 (18.27%) Active Directory
2 28 (7.11%) Hyper-V
2 28 (7.11%) VMware Infrastructure
3 13 (3.30%) vSphere
4 7 (1.78%) Docker
5 5 (1.27%) VMware NSX
6 4 (1.02%) Virtual Machines
7 3 (0.76%) Firmware
8 2 (0.51%) Terminal Services
9 1 (0.25%) BitLocker
9 1 (0.25%) Virtual Desktop
9 1 (0.25%) Virtual Servers
Systems Management
1 15 (3.81%) SCCM
2 13 (3.30%) Terraform
3 11 (2.79%) Microsoft Intune
4 5 (1.27%) Failover Clustering
4 5 (1.27%) Microsoft Clustering
4 5 (1.27%) Microsoft Data Protection Manager
5 4 (1.02%) Ansible
5 4 (1.02%) Grafana
5 4 (1.02%) Kibana
5 4 (1.02%) QRadar
6 3 (0.76%) Kubernetes
7 2 (0.51%) DatAdvantage
7 2 (0.51%) FortiGate
7 2 (0.51%) Rundeck
7 2 (0.51%) Symantec Endpoint Protection
7 2 (0.51%) vCenter Server
8 1 (0.25%) Active Directory Federation Services
8 1 (0.25%) FTK
8 1 (0.25%) Single Sign-On
8 1 (0.25%) Stealthwatch
Vendors
1 101 (25.63%) Microsoft
2 47 (11.93%) VMware
3 36 (9.14%) Oracle
3 36 (9.14%) ServiceNow
4 15 (3.81%) BMC
5 14 (3.55%) Cisco
5 14 (3.55%) Remedy
6 12 (3.05%) SAP
7 8 (2.03%) Dell
7 8 (2.03%) Splunk
8 5 (1.27%) Fortinet
8 5 (1.27%) Google
8 5 (1.27%) IBM
8 5 (1.27%) Meraki
8 5 (1.27%) Sage
8 5 (1.27%) Virgin Media
9 3 (0.76%) Citrix
9 3 (0.76%) Dynatrace
9 3 (0.76%) HP
9 3 (0.76%) ION Trading