Hybrid/Remote Windows 10 Job Trends

Microsoft Windows 10
UK > Work from Home

The table below provides summary statistics and salary benchmarking for remote or hybrid work requiring Windows 10 skills. It covers permanent job vacancies from the 6 months leading up to 28 November 2025, with comparisons to the same periods in the previous two years.

6 months to
28 Nov 2025
Same period 2024 Same period 2023
Rank 245 227 189
Rank change year-on-year -18 -38 +49
Permanent jobs citing Windows 10 134 285 383
As % of all permanent jobs with remote/hybrid work options 0.88% 1.44% 1.83%
As % of the Operating Systems category 10.21% 10.29% 11.41%
Number of salaries quoted 100 223 369
10th Percentile £26,250 £26,250 £22,750
25th Percentile £28,000 £28,749 £29,000
Median annual salary (50th Percentile) £32,000 £36,500 £40,000
Median % change year-on-year -12.33% -8.75% +6.67%
75th Percentile £41,000 £48,750 £57,500
90th Percentile £53,750 £62,000 £67,500
UK median annual salary £32,500 £37,500 £35,000
% change year-on-year -13.33% +7.14% -

All Operating Systems
Work from Home

Windows 10 falls under the Operating Systems category. For comparison with the information above, the following table provides summary statistics for all permanent job vacancies with remote or hybrid options requiring operating system skills.

Permanent vacancies with a requirement for operating system skills 1,312 2,769 3,356
As % of all permanent jobs with a WFH option 8.58% 13.95% 16.06%
Number of salaries quoted 970 1,719 2,846
10th Percentile £28,250 £30,000 £30,000
25th Percentile £34,000 £37,500 £40,000
Median annual salary (50th Percentile) £50,000 £52,500 £55,000
Median % change year-on-year -4.76% -4.55% -
75th Percentile £75,000 £71,991 £72,500
90th Percentile £87,500 £85,000 £87,750
UK median annual salary £42,500 £50,000 £50,000
% change year-on-year -15.00% - -4.76%

Windows 10
Job Vacancy Trend for Remote/Hybrid Jobs

Historical trend showing the proportion of permanent IT job postings citing Windows 10 and offering remote or hybrid work options relative to all permanent IT jobs advertised.
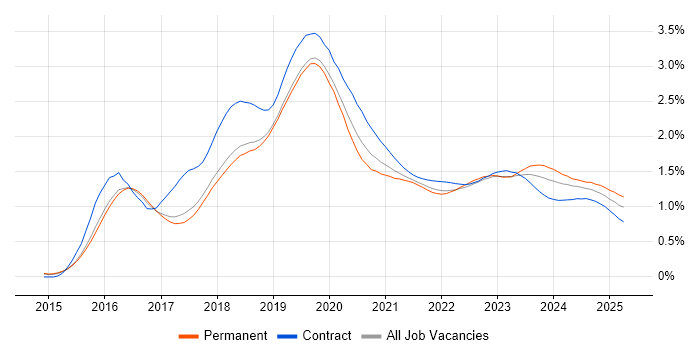
Windows 10 job vacancy trend for remote/hybrid jobs

Windows 10
Salary Trend for Remote/Hybrid Jobs

Salary distribution trend for jobs with remote/hybrid work options citing Windows 10.

Salary distribution trend for jobs with remote/hybrid work options citing Windows 10

Windows 10
Salary Histogram for Remote/Hybrid Jobs

Salary distribution for jobs with remote/hybrid work options citing Windows 10 over the 6 months to 28 November 2025.

Windows 10 salary histogram for jobs with remote/hybrid work options

Windows 10
Co-Occurring Skills & Capabilities in Remote/Hybrid Jobs by Category

The following tables expand on the one above by listing co-occurrences grouped by category. They cover the same employment type, locality and period, with up to 20 co-occurrences shown in each category:

Application Platforms
1 37 (27.61%) Microsoft Exchange
2 32 (23.88%) SharePoint
Applications
1 26 (19.40%) Microsoft Office
2 4 (2.99%) Microsoft Excel
3 1 (0.75%) Microsoft PowerPoint
Business Applications
1 7 (5.22%) Dynamics CRM
Cloud Services
1 123 (91.79%) Microsoft 365
2 52 (38.81%) Azure
3 43 (32.09%) Entra ID
4 12 (8.96%) Google Workspace
5 9 (6.72%) Power Platform
6 8 (5.97%) AWS
6 8 (5.97%) Dynamics 365
6 8 (5.97%) OneDrive
7 5 (3.73%) PowerApps
8 3 (2.24%) Azure Monitor
9 1 (0.75%) GCP
9 1 (0.75%) Microsoft Purview
Communications & Networking
1 41 (30.60%) VPN
2 37 (27.61%) DNS
3 34 (25.37%) DHCP
4 23 (17.16%) TCP/IP
5 19 (14.18%) WAN
6 18 (13.43%) LAN
7 12 (8.96%) VoIP
8 11 (8.21%) VLAN
9 10 (7.46%) Wi-Fi
10 9 (6.72%) Firewall
11 8 (5.97%) Wireless
12 4 (2.99%) SD-WAN
13 3 (2.24%) HTTP
14 2 (1.49%) Internet
14 2 (1.49%) IPsec
14 2 (1.49%) Network Security
14 2 (1.49%) SSL
15 1 (0.75%) BGP
15 1 (0.75%) Cisco IPT
15 1 (0.75%) OSPF
Database & Business Intelligence
1 1 (0.75%) Oracle Database
1 1 (0.75%) Oracle Reports
General
1 92 (68.66%) Social Skills
2 23 (17.16%) Back Office
3 11 (8.21%) Finance
4 9 (6.72%) Analytical Skills
4 9 (6.72%) Inclusion and Diversity
5 7 (5.22%) Organisational Skills
6 4 (2.99%) German Language
7 3 (2.24%) Public Sector
8 2 (1.49%) Manufacturing
9 1 (0.75%) Banking
9 1 (0.75%) Electronics
9 1 (0.75%) Games
9 1 (0.75%) Law
9 1 (0.75%) Legal
9 1 (0.75%) Marketing
9 1 (0.75%) Retail
9 1 (0.75%) Telecoms
Job Titles
1 58 (43.28%) IT Support
2 37 (27.61%) Support Engineer
3 35 (26.12%) Support Technician
4 27 (20.15%) IT Support Technician
4 27 (20.15%) IT Technician
5 25 (18.66%) Analyst
6 24 (17.91%) IT Engineer
7 23 (17.16%) Desktop Support
7 23 (17.16%) IT Support Engineer
8 19 (14.18%) 2nd Line Support
9 18 (13.43%) Desktop Engineer
10 15 (11.19%) Desktop Support Engineer
10 15 (11.19%) Support Analyst
11 12 (8.96%) 2nd Line Engineer
11 12 (8.96%) 2nd Line Support Engineer
12 9 (6.72%) IT Analyst
13 8 (5.97%) Desktop Technician
13 8 (5.97%) Senior Support Analyst
13 8 (5.97%) Service Analyst
13 8 (5.97%) Site Engineer
Libraries, Frameworks & Software Standards
1 7 (5.22%) .NET
2 1 (0.75%) SAML
Miscellaneous
1 30 (22.39%) Onboarding
2 27 (20.15%) Self-Motivation
3 24 (17.91%) Driving Licence
4 12 (8.96%) iPad
5 8 (5.97%) Hybrid Cloud
6 6 (4.48%) Video Conferencing
7 5 (3.73%) Enterprise Software
7 5 (3.73%) EPoS
7 5 (3.73%) iPhone
8 4 (2.99%) Client/Server
9 3 (2.24%) BYOD
9 3 (2.24%) CMDB
9 3 (2.24%) e-Learning
9 3 (2.24%) Linux Command Line
9 3 (2.24%) Mobile App
9 3 (2.24%) Product Ownership
9 3 (2.24%) Social Media
10 2 (1.49%) CCTV
10 2 (1.49%) Data Centre
10 2 (1.49%) Digital Signage
Operating Systems
1 134 (100.00%) Windows
2 41 (30.60%) Apple iOS
3 32 (23.88%) Windows Server
4 22 (16.42%) Mac OS
5 12 (8.96%) Windows Server 2016
6 6 (4.48%) Windows Server 2019
7 3 (2.24%) Android
7 3 (2.24%) Linux
7 3 (2.24%) Windows Server 2012
8 1 (0.75%) AIX
8 1 (0.75%) Windows 7
8 1 (0.75%) Windows Server 2003
Processes & Methodologies
1 61 (45.52%) ITIL
2 49 (36.57%) Customer Service
3 35 (26.12%) Problem-Solving
4 34 (25.37%) Continuous Improvement
5 33 (24.63%) Cybersecurity
6 28 (20.90%) Patch Management
7 22 (16.42%) Customer Experience
8 21 (15.67%) Software Deployment
8 21 (15.67%) User Experience
9 20 (14.93%) Analytics
9 20 (14.93%) Customer Acquisition
9 20 (14.93%) Ticket Management
10 16 (11.94%) ITSM
11 15 (11.19%) Service Management
12 14 (10.45%) Change Management
13 13 (9.70%) Problem Management
14 12 (8.96%) Migration
15 8 (5.97%) People Management
15 8 (5.97%) Service Delivery
16 7 (5.22%) CRM
Programming Languages
1 13 (9.70%) PowerShell
2 7 (5.22%) SQL
3 1 (0.75%) Python
Qualifications
1 35 (26.12%) Degree
2 24 (17.91%) Security Cleared
3 21 (15.67%) SC Cleared
4 20 (14.93%) CTC Cleared
5 8 (5.97%) Azure Certification
5 8 (5.97%) ITIL Certification
6 4 (2.99%) Cisco Certification
7 3 (2.24%) AWS Certification
7 3 (2.24%) BPSS Clearance
7 3 (2.24%) CCNA
7 3 (2.24%) DBS Check
7 3 (2.24%) MCSA
7 3 (2.24%) Microsoft Certification
8 1 (0.75%) A+ Certification
8 1 (0.75%) CCNP
8 1 (0.75%) CompTIA Security+
8 1 (0.75%) Computer Science Degree
8 1 (0.75%) ITIL Foundation Certificate
8 1 (0.75%) Network+ Certification
8 1 (0.75%) PhD
Quality Assurance & Compliance
1 30 (22.39%) SLA
2 3 (2.24%) GDPR
3 1 (0.75%) Basel III
3 1 (0.75%) MiFID
System Software
1 95 (70.90%) Active Directory
2 10 (7.46%) Hyper-V
3 3 (2.24%) BitLocker
3 3 (2.24%) Virtual Machines
3 3 (2.24%) VMware Infrastructure
4 1 (0.75%) Virtual Desktop
Systems Management
1 43 (32.09%) Microsoft Intune
2 15 (11.19%) Jamf Pro
3 12 (8.96%) SCCM
4 4 (2.99%) PaperCut
5 3 (2.24%) Active Directory Federation Services
6 1 (0.75%) FortiGate
6 1 (0.75%) Single Sign-On
6 1 (0.75%) ZABBIX
Vendors
1 103 (76.87%) Microsoft
2 28 (20.90%) Cisco
3 22 (16.42%) Apple
4 12 (8.96%) Google
5 10 (7.46%) Freshdesk
6 9 (6.72%) ServiceNow
7 8 (5.97%) HP
8 7 (5.22%) Datto
9 6 (4.48%) Meraki
10 5 (3.73%) Citrix
10 5 (3.73%) Logitech
11 4 (2.99%) VMware
12 2 (1.49%) SolarWinds
12 2 (1.49%) Sophos
13 1 (0.75%) Dell
13 1 (0.75%) IBM
13 1 (0.75%) SAP
13 1 (0.75%) Snow
13 1 (0.75%) Ubiquiti
13 1 (0.75%) Yealink