Hybrid/Remote Oracle Reports Job Trends

Oracle Reports
UK > Work from Home

The table below provides summary statistics and salary benchmarking for remote or hybrid work requiring Oracle Reports skills. It covers permanent job vacancies from the 6 months leading up to 18 November 2025, with comparisons to the same periods in the previous two years.

6 months to
18 Nov 2025
Same period 2024 Same period 2023
Rank 332 442 449
Rank change year-on-year +110 +7 +209
Permanent jobs citing Oracle Reports 43 16 42
As % of all permanent jobs with remote/hybrid work options 0.28% 0.082% 0.19%
As % of the Database & Business Intelligence category 1.85% 0.36% 0.78%
Number of salaries quoted 31 9 34
10th Percentile - £47,500 £36,125
25th Percentile £35,854 £51,250 £47,788
Median annual salary (50th Percentile) £40,000 £57,500 £60,000
Median % change year-on-year -30.43% -4.17% +5.73%
75th Percentile £59,375 £63,750 £68,750
90th Percentile £80,000 £83,500 £71,375
UK median annual salary £57,150 £62,500 £60,000
% change year-on-year -8.56% +4.17% +2.56%

All Database and Business Intelligence Skills
Work from Home

Oracle Reports falls under the Databases and Business Intelligence category. For comparison with the information above, the following table provides summary statistics for all permanent job vacancies with remote or hybrid options requiring database or business intelligence skills.

Permanent vacancies with a requirement for database or business intelligence skills 2,322 4,445 5,392
As % of all permanent jobs with a WFH option 15.30% 22.73% 24.87%
Number of salaries quoted 1,785 2,704 4,314
10th Percentile £35,500 £40,000 £40,000
25th Percentile £45,000 £48,750 £47,506
Median annual salary (50th Percentile) £60,000 £70,000 £60,000
Median % change year-on-year -14.29% +16.67% -
75th Percentile £80,000 £95,000 £77,715
90th Percentile £110,000 £122,500 £95,000
UK median annual salary £60,000 £65,000 £60,000
% change year-on-year -7.69% +8.33% -4.00%

Oracle Reports
Job Vacancy Trend for Remote/Hybrid Jobs

Historical trend showing the proportion of permanent IT job postings citing Oracle Reports and offering remote or hybrid work options relative to all permanent IT jobs advertised.
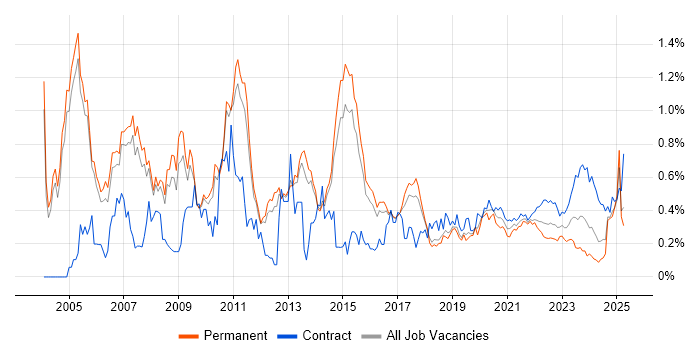
Oracle Reports job vacancy trend for remote/hybrid jobs

Oracle Reports
Salary Trend for Remote/Hybrid Jobs

Salary distribution trend for jobs with remote/hybrid work options citing Oracle Reports.

Salary distribution trend for jobs with remote/hybrid work options citing Oracle Reports

Oracle Reports
Salary Histogram for Remote/Hybrid Jobs

Salary distribution for jobs with remote/hybrid work options citing Oracle Reports over the 6 months to 18 November 2025.

Oracle Reports salary histogram for jobs with remote/hybrid work options

Oracle Reports
Co-Occurring Skills & Capabilities in Remote/Hybrid Jobs by Category

The following tables expand on the one above by listing co-occurrences grouped by category. They cover the same employment type, locality and period, with up to 20 co-occurrences shown in each category:

Application Platforms
1 3 (6.98%) Oracle Workflow
1 3 (6.98%) Tomcat
1 3 (6.98%) WebLogic
1 3 (6.98%) WebLogic Portal
Applications
1 19 (44.19%) Microsoft Excel
2 1 (2.33%) Spreadsheet
Business Applications
1 11 (25.58%) NetSuite
2 7 (16.28%) Oracle EBS
3 3 (6.98%) Oracle EBS R12
3 3 (6.98%) Oracle Financials
3 3 (6.98%) Primavera
4 2 (4.65%) Oracle Cash Management
4 2 (4.65%) Oracle ERP
4 2 (4.65%) Oracle Payables
4 2 (4.65%) Oracle Receivables
Cloud Services
1 7 (16.28%) Power Platform
2 5 (11.63%) AWS
2 5 (11.63%) Azure
2 5 (11.63%) Microsoft 365
3 4 (9.30%) OCI
Database & Business Intelligence
1 12 (27.91%) Oracle Database
2 7 (16.28%) Power BI
3 5 (11.63%) Crystal Reports
3 5 (11.63%) Oracle BI Publisher
4 3 (6.98%) Oracle Discoverer
4 3 (6.98%) SQL Server Integration Services
5 1 (2.33%) Data Warehouse
5 1 (2.33%) Power Query
Development Applications
1 6 (13.95%) Oracle Forms
2 3 (6.98%) Oracle APEX
General
1 23 (53.49%) Finance
2 16 (37.21%) Social Skills
3 13 (30.23%) Analytical Skills
4 11 (25.58%) Police
5 4 (9.30%) Manufacturing
6 3 (6.98%) Telecoms
7 2 (4.65%) Electronics
7 2 (4.65%) Marketing
7 2 (4.65%) Public Sector
8 1 (2.33%) Back Office
Job Titles
1 22 (51.16%) Analyst
2 17 (39.53%) Support Analyst
3 11 (25.58%) Development Analyst
3 11 (25.58%) Development Support Analyst
3 11 (25.58%) Systems Analyst
3 11 (25.58%) Systems Development Analyst
3 11 (25.58%) Systems Support
3 11 (25.58%) Systems Support Analyst
4 10 (23.26%) Accountant
4 10 (23.26%) Systems Accountant
5 7 (16.28%) ERP Analyst
6 6 (13.95%) Administrator
7 5 (11.63%) Applications Support
7 5 (11.63%) Applications Support Analyst
7 5 (11.63%) Developer
7 5 (11.63%) ERP Support
7 5 (11.63%) Oracle Developer
8 3 (6.98%) Data Analyst
9 2 (4.65%) Data Administrator
9 2 (4.65%) Technical Specialist
Libraries, Frameworks & Software Standards
1 19 (44.19%) Oracle Fusion
2 3 (6.98%) ModSecurity
2 3 (6.98%) Oracle ADF
2 3 (6.98%) WebCenter
3 2 (4.65%) REST
3 2 (4.65%) SOAP
Miscellaneous
1 13 (30.23%) Management Information System
2 2 (4.65%) Pricing Data
3 1 (2.33%) Data Structures
Operating Systems
1 4 (9.30%) Windows
2 3 (6.98%) Linux
2 3 (6.98%) Unix
3 1 (2.33%) AIX
3 1 (2.33%) Windows 10
3 1 (2.33%) Windows 7
3 1 (2.33%) Windows Server 2003
3 1 (2.33%) Windows Server 2016
Processes & Methodologies
1 24 (55.81%) Problem-Solving
2 19 (44.19%) ERP
3 16 (37.21%) Business Intelligence
3 16 (37.21%) ITIL
4 15 (34.88%) Continuous Improvement
5 13 (30.23%) Data Analysis
6 12 (27.91%) Data Visualisation
6 12 (27.91%) Decision-Making
6 12 (27.91%) Visualisation
7 11 (25.58%) Change Control
7 11 (25.58%) Collaborative Working
7 11 (25.58%) Data Security
7 11 (25.58%) Knowledge Management
8 10 (23.26%) Budgeting
8 10 (23.26%) Budgeting and Forecasting
8 10 (23.26%) Financial Analysis
8 10 (23.26%) Financial Modelling
8 10 (23.26%) Planning and Forecasting
8 10 (23.26%) Process Improvement
9 8 (18.60%) Agile
Programming Languages
1 28 (65.12%) SQL
2 10 (23.26%) VBA
3 6 (13.95%) PL/SQL
4 3 (6.98%) JavaScript
5 1 (2.33%) Data Analysis Expressions
Qualifications
1 11 (25.58%) BPSS Clearance
1 11 (25.58%) ITIL Foundation Certificate
2 10 (23.26%) ACCA
2 10 (23.26%) CIMA
3 3 (6.98%) DV Cleared
3 3 (6.98%) SC Cleared
3 3 (6.98%) Security Cleared
Quality Assurance & Compliance
1 12 (27.91%) Data Quality
2 1 (2.33%) QA
System Software
1 3 (6.98%) Active Directory
Systems Management
1 3 (6.98%) Oracle Enterprise Manager
Vendors
1 43 (100.00%) Oracle
2 14 (32.56%) SAP
3 10 (23.26%) Adaptive Insights
3 10 (23.26%) Workday
4 6 (13.95%) Microsoft
5 3 (6.98%) IFS
6 1 (2.33%) Citrix
6 1 (2.33%) IBM