Police Jobs with Work from Home Options

Police
UK > Work from Home

The table below looks at the prevalence of the term Police in permanent job vacancies with an option to work from home (WFH). Included is a benchmarking guide to the salaries offered in vacancies that have cited Police over the 6 months to 11 May 2024 with a comparison to the same period over the previous 2 years.

6 months to
11 May 2024
Same period 2023 Same period 2022
Rank 406 294 690
Rank change year-on-year -112 +396 -139
Permanent jobs citing Police 186 480 154
As % of all permanent jobs with a WFH option 0.55% 1.17% 0.22%
As % of the General category 0.90% 1.77% 0.36%
Number of salaries quoted 130 30 85
10th Percentile £35,000 £28,000 £31,588
25th Percentile £43,115 £34,844 £34,373
Median annual salary (50th Percentile) £47,250 £40,715 £39,759
Median % change year-on-year +16.05% +2.40% -20.48%
75th Percentile £62,738 £55,859 £55,000
90th Percentile £73,894 £72,500 £81,250
UK median annual salary £45,000 £48,250 £40,531
% change year-on-year -6.74% +19.05% +1.81%

All General Skills
Work from Home

Police is in the General Skills category. The following table is for comparison with the above and provides summary statistics for all permanent job vacancies with a WFH option and a requirement for common skills.

Permanent vacancies with a requirement for common skills 20,766 27,139 43,370
As % of all permanent jobs with a WFH option 61.44% 65.94% 63.07%
Number of salaries quoted 15,093 18,120 24,402
10th Percentile £31,750 £36,250 £35,000
25th Percentile £41,750 £46,570 £45,000
Median annual salary (50th Percentile) £55,000 £62,500 £60,000
Median % change year-on-year -12.00% +4.17% +9.09%
75th Percentile £75,000 £82,548 £79,600
90th Percentile £95,000 £102,500 £95,000
UK median annual salary £52,500 £60,000 £60,000
% change year-on-year -12.50% - +9.09%

Police
Trend for Jobs with a WFH Option

Job vacancies with a work from home option citing Police as a proportion of all IT jobs advertised.
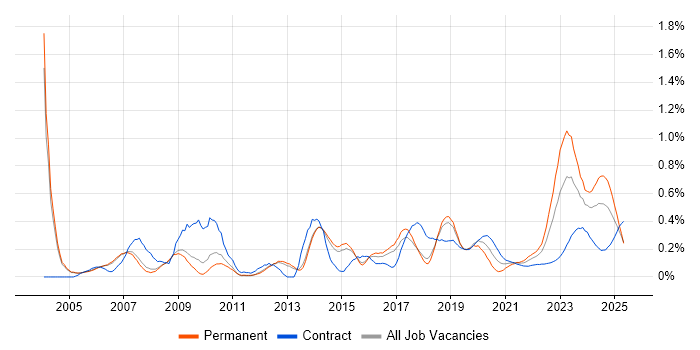
Police trend for jobs with a WFH option

Police
Salary Trend for Jobs with a WFH Option

3-month moving average salary quoted in job vacancies with a work from home option citing Police.

Police salary trend for jobs with a WFH option

Police
Salary Histogram for Jobs with a WFH Option

Salary distribution for jobs with a work from home option citing Police over the 6 months to 11 May 2024.

Police salary histogram for jobs with a WFH option

Police
Co-occurring Skills and Capabilities with WFH Options by Category

The follow tables expand on the table above by listing co-occurrences grouped by category. The same employment type, locality and period is covered with up to 20 co-occurrences shown in each of the following categories:

Application Platforms
1 24 (12.90%) Apache
1 24 (12.90%) IIS
1 24 (12.90%) Tomcat
2 18 (9.68%) Confluence
3 2 (1.08%) Oracle Workflow
4 1 (0.54%) SharePoint
Applications
1 16 (8.60%) Microsoft Office
2 9 (4.84%) Microsoft Excel
3 2 (1.08%) Microsoft PowerPoint
3 2 (1.08%) Spreadsheet
4 1 (0.54%) Microsoft Project
Business Applications
1 34 (18.28%) NEC Housing
2 8 (4.30%) Oracle EBS
3 3 (1.61%) Oracle ERP
3 3 (1.61%) Unit4 Business World
4 2 (1.08%) Oracle EBS R12
Cloud Services
1 36 (19.35%) Azure
2 20 (10.75%) Azure DevOps
3 10 (5.38%) PaaS
4 8 (4.30%) SaaS
5 7 (3.76%) IaaS
6 6 (3.23%) Entra ID
7 4 (2.15%) AWS
7 4 (2.15%) OCI
8 3 (1.61%) Azure Service Fabric
9 2 (1.08%) GCP
10 1 (0.54%) Cloud Computing
Communications & Networking
1 10 (5.38%) Firewall
2 9 (4.84%) CTI
3 5 (2.69%) Network Security
4 4 (2.15%) VSAN
4 4 (2.15%) Wireless
5 2 (1.08%) LAN
6 1 (0.54%) BGP
6 1 (0.54%) Cisco ASA
6 1 (0.54%) Cisco IOS
6 1 (0.54%) Cisco Nexus
6 1 (0.54%) Spanning Tree
6 1 (0.54%) WAN
Database & Business Intelligence
1 28 (15.05%) Oracle Database
2 5 (2.69%) SQL Server
3 4 (2.15%) Azure SQL Database
4 2 (1.08%) BusinessObjects
4 2 (1.08%) Oracle Reports
5 1 (0.54%) Metadata
5 1 (0.54%) MongoDB
5 1 (0.54%) MySQL
5 1 (0.54%) NoSQL
5 1 (0.54%) Relational Database
Development Applications
1 29 (15.59%) Git
2 23 (12.37%) JIRA
3 18 (9.68%) Jenkins
4 14 (7.53%) Team Foundation Server
5 11 (5.91%) Visual Studio
6 3 (1.61%) Selenium
7 2 (1.08%) Oracle Forms
General
1 69 (37.10%) Public Sector
2 55 (29.57%) Finance
3 54 (29.03%) Social Skills
4 46 (24.73%) Local Government
5 42 (22.58%) Inclusion and Diversity
6 21 (11.29%) Retail
7 19 (10.22%) Law
8 18 (9.68%) Analytical Skills
9 10 (5.38%) Back Office
9 10 (5.38%) Marketing
10 8 (4.30%) Electronics
10 8 (4.30%) Legal
11 7 (3.76%) Fire and Rescue
12 4 (2.15%) Banking
12 4 (2.15%) Influencing Skills
12 4 (2.15%) Telecoms
13 3 (1.61%) Documentation Skills
13 3 (1.61%) Welsh Language
14 2 (1.08%) Organisational Skills
14 2 (1.08%) Presentation Skills
Job Titles
1 42 (22.58%) Analyst
1 42 (22.58%) Senior
2 40 (21.51%) Developer
3 24 (12.90%) Applications Support
4 23 (12.37%) Lead
5 21 (11.29%) Test Analyst
6 20 (10.75%) Senior Developer
7 18 (9.68%) Java Developer
7 18 (9.68%) Senior Java Developer
8 17 (9.14%) Architect
9 11 (5.91%) Senior Analyst
9 11 (5.91%) Software Developer
10 10 (5.38%) Lead Architect
10 10 (5.38%) Systems Developer
11 9 (4.84%) Data Manager
11 9 (4.84%) Forensic Manager
11 9 (4.84%) Lead Software Architect
11 9 (4.84%) Software Architect
11 9 (4.84%) Team Leader
12 8 (4.30%) Senior Test Analyst
Libraries, Frameworks & Software Standards
1 34 (18.28%) Web Services
2 22 (11.83%) .NET
3 19 (10.22%) Spring
4 18 (9.68%) RESTful
5 10 (5.38%) .NET Core
5 10 (5.38%) CSS
6 6 (3.23%) Oracle Fusion
6 6 (3.23%) SOAP
7 4 (2.15%) Entity Framework
8 3 (1.61%) ARM Templates
8 3 (1.61%) SailPoint
8 3 (1.61%) YAML
9 2 (1.08%) JPA
9 2 (1.08%) Oracle ADF
9 2 (1.08%) XML
10 1 (0.54%) .NET Framework
10 1 (0.54%) Node.js
10 1 (0.54%) WinForms
10 1 (0.54%) WPF
Miscellaneous
1 27 (14.52%) Public Cloud
2 11 (5.91%) Management Information System
3 4 (2.15%) PKI
4 3 (1.61%) Self-Motivation
5 1 (0.54%) Blog
5 1 (0.54%) CCTV
5 1 (0.54%) Driving Licence
5 1 (0.54%) Podcast
Operating Systems
1 40 (21.51%) Windows
2 26 (13.98%) Linux
2 26 (13.98%) Unix
3 24 (12.90%) Solaris
4 4 (2.15%) Windows Server
5 3 (1.61%) Windows 10
6 2 (1.08%) AIX
6 2 (1.08%) Oracle Linux
Processes & Methodologies
1 35 (18.82%) Problem-Solving
2 34 (18.28%) Agile
3 29 (15.59%) Business Strategy
4 28 (15.05%) Task Automation
5 26 (13.98%) Data Security
6 24 (12.90%) Network Architecture
6 24 (12.90%) Server Management
7 23 (12.37%) DevOps
8 19 (10.22%) Impact Assessments
8 19 (10.22%) Test Automation
9 18 (9.68%) Actionable Insight
10 17 (9.14%) CI/CD
10 17 (9.14%) Scenario Testing
11 16 (8.60%) ITIL
12 15 (8.06%) Customer Service
12 15 (8.06%) Software Testing
13 14 (7.53%) Continuous Improvement
13 14 (7.53%) Data Analysis
13 14 (7.53%) Performance Testing
14 13 (6.99%) Functional Testing
Programming Languages
1 27 (14.52%) Java
2 25 (13.44%) C#
3 24 (12.90%) Shell Script
4 15 (8.06%) SQL
5 3 (1.61%) C++
6 2 (1.08%) PL/SQL
6 2 (1.08%) VBA
Qualifications
1 106 (56.99%) Security Cleared
2 62 (33.33%) SC Cleared
3 50 (26.88%) Degree
4 21 (11.29%) DBS Check
5 10 (5.38%) DV Cleared
6 5 (2.69%) APMP
7 4 (2.15%) MCSA
7 4 (2.15%) Microsoft Certification
8 3 (1.61%) Azure Certification
9 2 (1.08%) AWS Certification
9 2 (1.08%) AWS Certified Solutions Architect
9 2 (1.08%) CTC Cleared
9 2 (1.08%) ISTQB
9 2 (1.08%) ISTQB Foundation Certification
10 1 (0.54%) (ISC)2 CCSP
10 1 (0.54%) CESG Certified Professional
10 1 (0.54%) Cisco Certification
10 1 (0.54%) CISSP
10 1 (0.54%) CRISC
10 1 (0.54%) Six Sigma Green Belt
Quality Assurance & Compliance
1 38 (20.43%) Accessibility
2 25 (13.44%) QA
3 5 (2.69%) SLA
4 4 (2.15%) GDPR
5 3 (1.61%) ISO/IEC 27001
5 3 (1.61%) NIST
6 2 (1.08%) Data Quality
6 2 (1.08%) PMO
7 1 (0.54%) NCSC
System Software
1 14 (7.53%) Active Directory
2 9 (4.84%) Firmware
3 6 (3.23%) Embedded Firmware
4 4 (2.15%) VMware Infrastructure
4 4 (2.15%) vSphere
5 3 (1.61%) Virtual Desktop
Systems Management
1 4 (2.15%) Ansible
1 4 (2.15%) SCCM
1 4 (2.15%) Terraform
2 3 (1.61%) Active Directory Federation Services
2 3 (1.61%) Microsoft Intune
2 3 (1.61%) Nessus
2 3 (1.61%) Single Sign-On
Vendors
1 66 (35.48%) Microsoft
2 43 (23.12%) Oracle
3 34 (18.28%) NEC
4 9 (4.84%) webMethods
5 6 (3.23%) Cisco
6 5 (2.69%) Google
7 4 (2.15%) Dell
7 4 (2.15%) HP
7 4 (2.15%) VMware
8 3 (1.61%) Blue Prism
8 3 (1.61%) ServiceNow
8 3 (1.61%) UiPath
9 2 (1.08%) Cadence
9 2 (1.08%) IBM
10 1 (0.54%) Pega