Hybrid/Remote Spreadsheet Job Trends

Spreadsheets
UK > Work from Home

The table below provides summary statistics and salary benchmarking for remote or hybrid work requiring Spreadsheet skills. It covers permanent job vacancies from the 6 months leading up to 22 October 2025, with comparisons to the same periods in the previous two years.

6 months to
22 Oct 2025
Same period 2024 Same period 2023
Rank 353 435 465
Rank change year-on-year +82 +30 +244
Permanent jobs citing Spreadsheet 55 38 38
As % of all permanent jobs with remote/hybrid work options 0.34% 0.19% 0.17%
As % of the Applications category 1.73% 2.59% 2.34%
Number of salaries quoted 36 19 33
10th Percentile - £27,250 £29,250
25th Percentile £26,250 £30,000 £41,250
Median annual salary (50th Percentile) £28,750 £45,000 £45,000
Median % change year-on-year -36.11% - -10.00%
75th Percentile £57,500 £62,500 £56,750
90th Percentile £58,750 £81,750 £59,500
UK median annual salary £38,000 £42,500 £42,500
% change year-on-year -10.59% - +3.66%

All Software Application Skills
Work from Home

Spreadsheet falls under the Software Applications category. For comparison with the information above, the following table provides summary statistics for all permanent job vacancies with remote or hybrid options requiring software application skills.

Permanent vacancies with a requirement for software application skills 3,177 1,470 1,623
As % of all permanent jobs with a WFH option 19.50% 7.26% 7.08%
Number of salaries quoted 808 814 1,276
10th Percentile £26,500 £27,250 £28,500
25th Percentile £32,500 £34,750 £37,000
Median annual salary (50th Percentile) £45,000 £45,192 £52,350
Median % change year-on-year -0.42% -13.67% +4.70%
75th Percentile £61,250 £70,000 £66,313
90th Percentile £77,500 £83,750 £80,000
UK median annual salary £40,000 £47,500 £45,000
% change year-on-year -15.79% +5.56% -

Spreadsheet
Job Vacancy Trend for Remote/Hybrid Jobs

Historical trend showing the proportion of permanent IT job postings citing Spreadsheet and offering remote or hybrid work options relative to all permanent IT jobs advertised.
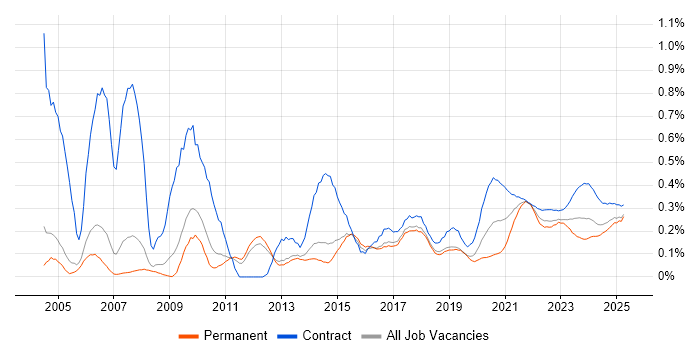
Spreadsheet job vacancy trend for remote/hybrid jobs

Spreadsheet
Salary Trend for Remote/Hybrid Jobs

Salary distribution trend for jobs with remote/hybrid work options citing Spreadsheet.

Salary distribution trend for jobs with remote/hybrid work options citing Spreadsheet

Spreadsheet
Salary Histogram for Remote/Hybrid Jobs

Salary distribution for jobs with remote/hybrid work options citing Spreadsheet over the 6 months to 22 October 2025.

Spreadsheet salary histogram for jobs with remote/hybrid work options

Spreadsheet
Co-Occurring Skills & Capabilities in Remote/Hybrid Jobs by Category

The following tables expand on the one above by listing co-occurrences grouped by category. They cover the same employment type, locality and period, with up to 20 co-occurrences shown in each category:

Application Platforms
1 6 (10.91%) IIS
2 4 (7.27%) SharePoint
Applications
1 28 (50.91%) Microsoft Excel
2 20 (36.36%) Microsoft Office
3 13 (23.64%) Microsoft PowerPoint
4 4 (7.27%) Photoshop
5 1 (1.82%) MS Visio
Business Applications
1 4 (7.27%) Shopify
2 1 (1.82%) NetSuite
Cloud Services
1 11 (20.00%) Microsoft 365
1 11 (20.00%) Power Platform
2 9 (16.36%) Azure
3 6 (10.91%) Azure Storage
4 4 (7.27%) Google Analytics
5 3 (5.45%) Google Sheets
6 2 (3.64%) Azure Data Factory
6 2 (3.64%) Google Docs
6 2 (3.64%) Google Drive
6 2 (3.64%) Power Automate
6 2 (3.64%) PowerApps
7 1 (1.82%) SaaS
7 1 (1.82%) SuccessFactors
Communications & Networking
1 6 (10.91%) Firewall
1 6 (10.91%) SD-WAN
1 6 (10.91%) SSL
1 6 (10.91%) VPN
1 6 (10.91%) WAN
2 1 (1.82%) Internet
Database & Business Intelligence
1 11 (20.00%) Power BI
2 4 (7.27%) SQL Server
3 3 (5.45%) Data Warehouse
4 2 (3.64%) Azure SQL Data Warehouse
4 2 (3.64%) Azure SQL Database
5 1 (1.82%) MS Access
5 1 (1.82%) Oracle Database
5 1 (1.82%) Oracle Reports
5 1 (1.82%) Power Query
General
1 30 (54.55%) Social Skills
2 28 (50.91%) Analytical Skills
3 27 (49.09%) Finance
4 10 (18.18%) Billing
5 8 (14.55%) Marketing
6 7 (12.73%) Inclusion and Diversity
7 6 (10.91%) Retail
8 4 (7.27%) Legal
9 2 (3.64%) Games
9 2 (3.64%) Organisational Skills
10 1 (1.82%) Public Sector
Job Titles
1 20 (36.36%) Analyst
2 13 (23.64%) IT Analyst
3 12 (21.82%) IT Support
3 12 (21.82%) IT Support Analyst
3 12 (21.82%) Support Analyst
3 12 (21.82%) Technical Analyst
3 12 (21.82%) Technical Support
3 12 (21.82%) Technical Support Analyst
4 9 (16.36%) Junior
5 6 (10.91%) Cloud Engineer
5 6 (10.91%) Cloud Infrastructure Engineer
5 6 (10.91%) Infrastructure Engineer
5 6 (10.91%) Senior
6 5 (9.09%) Data Analyst
7 4 (7.27%) Administrator
7 4 (7.27%) Developer
7 4 (7.27%) E-Commerce Specialist
7 4 (7.27%) Junior Account Manager
7 4 (7.27%) Portfolio Manager
7 4 (7.27%) Senior Manager
Libraries, Frameworks & Software Standards
1 4 (7.27%) HTML
Miscellaneous
1 14 (25.45%) Management Information System
2 12 (21.82%) Onboarding
3 6 (10.91%) CMDB
4 5 (9.09%) Self-Motivation
5 2 (3.64%) Algorithms
5 2 (3.64%) Analytical Mindset
5 2 (3.64%) Foreign Exchange (FX)
5 2 (3.64%) Learning Management System
6 1 (1.82%) Data Structures
6 1 (1.82%) Social Media
Operating Systems
1 8 (14.55%) Windows
2 6 (10.91%) Windows Server
3 2 (3.64%) Windows 10
Processes & Methodologies
1 19 (34.55%) Data Analysis
1 19 (34.55%) Problem-Solving
2 12 (21.82%) Regulatory Compliance
2 12 (21.82%) Release Management
3 10 (18.18%) Business Development
4 8 (14.55%) Analytics
4 8 (14.55%) CRM
4 8 (14.55%) Disaster Recovery
4 8 (14.55%) Portfolio Management
4 8 (14.55%) Workflow
5 7 (12.73%) Agile
5 7 (12.73%) Business Intelligence
5 7 (12.73%) Migration
5 7 (12.73%) Process Improvement
6 6 (10.91%) Capacity Planning
6 6 (10.91%) Continuous Improvement
6 6 (10.91%) Infrastructure Engineering
6 6 (10.91%) Proactive Monitoring
6 6 (10.91%) Storage Management
7 5 (9.09%) Decision-Making
Programming Languages
1 17 (30.91%) SQL
2 6 (10.91%) PowerShell
3 4 (7.27%) Python
3 4 (7.27%) R
4 1 (1.82%) Data Analysis Expressions
4 1 (1.82%) VBA
Qualifications
1 8 (14.55%) AAT
1 8 (14.55%) ACCA
2 6 (10.91%) Degree
3 3 (5.45%) Azure Certification
3 3 (5.45%) DBS Check
3 3 (5.45%) Microsoft Certification
4 2 (3.64%) Master's Degree
Quality Assurance & Compliance
1 3 (5.45%) Data Quality
2 2 (3.64%) Accessibility
2 2 (3.64%) Actionable Recommendations
2 2 (3.64%) PMO
2 2 (3.64%) QA
3 1 (1.82%) GDPR
3 1 (1.82%) P3O
3 1 (1.82%) SLA
System Software
1 6 (10.91%) Hyper-V
1 6 (10.91%) Virtual Servers
Systems Management
1 6 (10.91%) Microsoft Intune
1 6 (10.91%) Terraform
Vendors
1 25 (45.45%) Microsoft
2 9 (16.36%) Sage
3 8 (14.55%) Xero
4 7 (12.73%) Google
5 6 (10.91%) SonicWALL
6 3 (5.45%) Salesforce
7 2 (3.64%) Adobe
7 2 (3.64%) Freshdesk
8 1 (1.82%) Foundry
8 1 (1.82%) HubSpot
8 1 (1.82%) Oracle
8 1 (1.82%) SAP