OCI Jobs with Work from Home Options

Oracle Cloud Infrastructure (Oracle OCI, Oracle Cloud)
UK > Work from Home

The table below provides summary statistics for permanent remote or hybrid work requiring OCI skills. It includes a benchmarking guide to the annual salaries offered in vacancies that cited OCI over the 6 months leading up to 26 July 2024, comparing them to the same period in the previous two years.

6 months to
26 Jul 2024
Same period 2023 Same period 2022
Rank 454 344 706
Rank change year-on-year -110 +362 -395
Permanent jobs citing OCI 79 256 207
As % of all permanent jobs with a WFH option 0.28% 0.78% 0.26%
As % of the Cloud Services category 0.68% 1.62% 0.50%
Number of salaries quoted 56 114 168
10th Percentile £50,500 £39,294 £45,500
25th Percentile £63,438 £41,250 £56,250
Median annual salary (50th Percentile) £72,500 £60,000 £70,000
Median % change year-on-year +20.83% -14.29% -6.67%
75th Percentile £84,964 £72,500 £87,813
90th Percentile £92,500 £89,550 £99,125
UK median annual salary £70,500 £60,500 £72,500
% change year-on-year +16.53% -16.55% +3.57%

All Cloud Skills
Work from Home

OCI falls under the Cloud Services category. For comparison with the information above, the following table provides summary statistics for all permanent job vacancies with remote or hybrid options requiring cloud computing skills.

Permanent vacancies with a requirement for cloud computing skills 11,565 15,776 41,709
As % of all permanent jobs with a WFH option 41.40% 48.07% 53.11%
Number of salaries quoted 9,006 12,359 22,853
10th Percentile £36,250 £37,866 £37,500
25th Percentile £46,250 £48,750 £46,250
Median annual salary (50th Percentile) £62,500 £65,000 £65,000
Median % change year-on-year -3.85% - +8.33%
75th Percentile £83,750 £83,750 £83,750
90th Percentile £107,500 £102,500 £97,132
UK median annual salary £60,000 £62,500 £62,500
% change year-on-year -4.00% - +4.17%

OCI
Trend for Jobs with a WFH Option

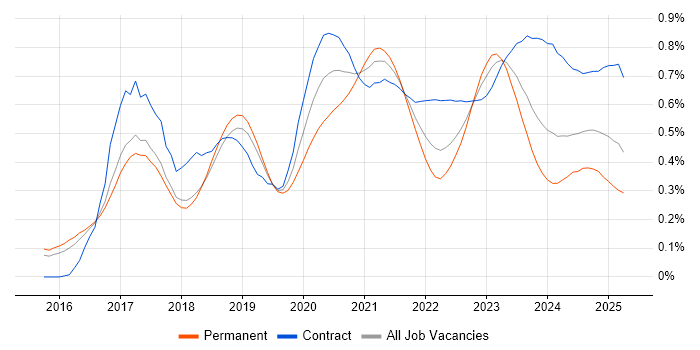
Job vacancies with a work from home option citing OCI as a proportion of all IT jobs advertised.

OCI trend for jobs with a WFH option

OCI
Salary Trend for Jobs with a WFH Option

3-month moving average salary quoted in job vacancies with a work from home option citing OCI.

OCI salary trend for jobs with a WFH option

OCI
Salary Histogram for Jobs with a WFH Option

Salary distribution for jobs with a work from home option citing OCI over the 6 months to 26 July 2024.

OCI salary histogram for jobs with a WFH option

OCI
Co-occurring Skills and Capabilities with WFH Options by Category

The follow tables expand on the table above by listing co-occurrences grouped by category. The same employment type, locality and period is covered with up to 20 co-occurrences shown in each of the following categories:

Application Platforms
1 3 (3.80%) CloudStack
2 2 (2.53%) Oracle Workflow
3 1 (1.27%) Confluence
3 1 (1.27%) SharePoint
Applications
1 2 (2.53%) Microsoft Office
2 1 (1.27%) Microsoft Excel
Business Applications
1 11 (13.92%) Oracle ERP
2 9 (11.39%) Oracle EBS
2 9 (11.39%) PeopleSoft HCM
3 6 (7.59%) Oracle Financial Analyzer
3 6 (7.59%) Oracle General Ledger
3 6 (7.59%) Oracle Subledger Accounting
4 5 (6.33%) Dynamics CRM
5 2 (2.53%) Oracle Payables
5 2 (2.53%) Oracle Payroll
5 2 (2.53%) Oracle SCM
6 1 (1.27%) Oracle Assets
6 1 (1.27%) Oracle Financials
6 1 (1.27%) Oracle Procure-to-Pay
6 1 (1.27%) Oracle Receivables
Cloud Services
1 32 (40.51%) AWS
1 32 (40.51%) Azure
2 10 (12.66%) GCP
3 8 (10.13%) Power Platform
4 7 (8.86%) SaaS
5 6 (7.59%) Dynamics 365
6 4 (5.06%) Azure Data Factory
6 4 (5.06%) Cloud Computing
7 3 (3.80%) PaaS
8 2 (2.53%) Azure Logic Apps
9 1 (1.27%) Microsoft 365
9 1 (1.27%) PowerApps
Communications & Networking
1 11 (13.92%) WAN
1 11 (13.92%) Wireless
2 10 (12.66%) Ethernet
2 10 (12.66%) LAN
3 5 (6.33%) Network Security
4 4 (5.06%) IPsec
4 4 (5.06%) VPN
5 3 (3.80%) iSCSI
6 2 (2.53%) Broadband
6 2 (2.53%) FTP
6 2 (2.53%) Skype
7 1 (1.27%) 5G
7 1 (1.27%) Internet
7 1 (1.27%) SAN
7 1 (1.27%) SD-WAN
Database & Business Intelligence
1 8 (10.13%) SQL Server
2 6 (7.59%) SAP BW
3 4 (5.06%) InfluxDB
3 4 (5.06%) Oracle Reports
4 3 (3.80%) Oracle BI Publisher
5 2 (2.53%) Oracle Database
5 2 (2.53%) RDBMS
5 2 (2.53%) Relational Database
Development Applications
1 7 (8.86%) Git
2 4 (5.06%) Jenkins
2 4 (5.06%) TeamCity
3 1 (1.27%) JIRA
General
1 52 (65.82%) Finance
2 32 (40.51%) Social Skills
3 19 (24.05%) Law
3 19 (24.05%) Legal
4 10 (12.66%) Analytical Skills
5 9 (11.39%) Inclusion and Diversity
6 7 (8.86%) Back Office
7 6 (7.59%) General Ledger
7 6 (7.59%) Telecoms
8 3 (3.80%) Public Sector
9 2 (2.53%) Banking
10 1 (1.27%) Billing
10 1 (1.27%) Local Government
Job Titles
1 18 (22.78%) Lead
2 15 (18.99%) Consultant
2 15 (18.99%) Developer
3 13 (16.46%) Integration Developer
4 12 (15.19%) Architect
5 11 (13.92%) Oracle Consultant
6 10 (12.66%) Domain Architect
6 10 (12.66%) Lead Architect
6 10 (12.66%) Network Architect
6 10 (12.66%) Project Manager
7 9 (11.39%) Oracle Project Manager
8 8 (10.13%) Cloud Consultant
8 8 (10.13%) Oracle Developer
9 6 (7.59%) Senior
10 5 (6.33%) .NET Developer
10 5 (6.33%) Azure Developer
10 5 (6.33%) C# .NET Developer
10 5 (6.33%) C# Developer
10 5 (6.33%) Designer
10 5 (6.33%) Systems Developer
Libraries, Frameworks & Software Standards
1 35 (44.30%) Oracle Fusion
2 11 (13.92%) Web Services
3 7 (8.86%) .NET
4 5 (6.33%) HTML
4 5 (6.33%) XML
5 3 (3.80%) REST
5 3 (3.80%) SOAP
Miscellaneous
1 10 (12.66%) Cloud Native
2 8 (10.13%) Enterprise Software
3 6 (7.59%) Reinsurance
4 4 (5.06%) Clustering
4 4 (5.06%) Linux Command Line
4 4 (5.06%) Onboarding
4 4 (5.06%) Replication
5 3 (3.80%) Management Information System
6 2 (2.53%) IoT
Operating Systems
1 11 (13.92%) Linux
2 8 (10.13%) Oracle Linux
3 7 (8.86%) Red Hat Enterprise Linux
4 4 (5.06%) Solaris
4 4 (5.06%) Windows
5 3 (3.80%) SUSE
5 3 (3.80%) SUSE Linux Enterprise Server
5 3 (3.80%) VMS
6 1 (1.27%) Windows Server
Processes & Methodologies
1 29 (36.71%) ERP
2 26 (32.91%) Problem-Solving
3 23 (29.11%) Design Patterns
4 22 (27.85%) Roadmaps
5 21 (26.58%) Continuous Improvement
6 18 (22.78%) Coaching
6 18 (22.78%) Mentoring
7 17 (21.52%) Architectural Patterns
8 16 (20.25%) Technology Roadmap
9 14 (17.72%) Analytics
10 12 (15.19%) Agile
11 11 (13.92%) Waterfall
12 10 (12.66%) Data Integration
12 10 (12.66%) IT Strategy
12 10 (12.66%) Migration
12 10 (12.66%) Network Architecture
13 9 (11.39%) PRINCE2
13 9 (11.39%) Unit Testing
14 8 (10.13%) DevOps
14 8 (10.13%) Scrum
Programming Languages
1 12 (15.19%) Python
2 11 (13.92%) C#
3 7 (8.86%) SQL
4 5 (6.33%) Java
5 4 (5.06%) Bash
5 4 (5.06%) PowerShell
6 3 (3.80%) Go
6 3 (3.80%) Perl
6 3 (3.80%) PL/SQL
Qualifications
1 10 (12.66%) Oracle Certification
2 7 (8.86%) Security Cleared
3 6 (7.59%) Degree
4 3 (3.80%) BPSS Clearance
4 3 (3.80%) PMI Certification
4 3 (3.80%) PMP
5 2 (2.53%) PRINCE2 Certification
5 2 (2.53%) SC Cleared
6 1 (1.27%) ACCA
6 1 (1.27%) CIMA
6 1 (1.27%) DBS Check
6 1 (1.27%) PRINCE2 Practitioner
Quality Assurance & Compliance
1 8 (10.13%) GDPR
2 7 (8.86%) QA
3 6 (7.59%) GAAP
3 6 (7.59%) IFRS
4 1 (1.27%) Accessibility
4 1 (1.27%) Cyber Essentials
4 1 (1.27%) ISO/IEC 27001
4 1 (1.27%) ITGC
4 1 (1.27%) PMO
System Software
1 7 (8.86%) Docker
2 3 (3.80%) Ceph
2 3 (3.80%) Gluster
2 3 (3.80%) KVM
2 3 (3.80%) oVirt
2 3 (3.80%) Virtual Machines
3 1 (1.27%) Active Directory
Systems Management
1 8 (10.13%) Terraform
2 7 (8.86%) Ansible
2 7 (8.86%) Kubernetes
2 7 (8.86%) Prometheus
3 4 (5.06%) Grafana
3 4 (5.06%) Istio
4 3 (3.80%) Graylog
4 3 (3.80%) Observium
4 3 (3.80%) Puppet
4 3 (3.80%) ZABBIX
5 1 (1.27%) WSUS
Vendors
1 69 (87.34%) Oracle
2 15 (18.99%) PeopleSoft
3 10 (12.66%) Microsoft
4 8 (10.13%) Hyperion
4 8 (10.13%) JD Edwards
5 6 (7.59%) SAP
6 4 (5.06%) Serena
7 3 (3.80%) Google
8 2 (2.53%) Virgin Media
9 1 (1.27%) Citrix
9 1 (1.27%) Meraki
9 1 (1.27%) NetApp
9 1 (1.27%) ServiceNow
9 1 (1.27%) VMware