REST Jobs with Work from Home Options

Representational State Transfer (REST)
UK > Work from Home

The table below provides summary statistics for permanent remote or hybrid work requiring REST skills. It includes a benchmarking guide to the annual salaries offered in vacancies that cited REST over the 6 months leading up to 26 July 2024, comparing them to the same period in the previous two years.

6 months to
26 Jul 2024
Same period 2023 Same period 2022
Rank 168 110 69
Rank change year-on-year -58 -41 -21
Permanent jobs citing REST 559 936 3,937
As % of all permanent jobs with a WFH option 2.00% 2.85% 5.01%
As % of the Libraries, Frameworks & Software Standards category 7.78% 8.74% 11.25%
Number of salaries quoted 496 805 1,800
10th Percentile £42,500 £45,000 £40,000
25th Percentile £48,750 £52,000 £48,750
Median annual salary (50th Percentile) £60,000 £67,500 £62,500
Median % change year-on-year -11.11% +8.00% +8.70%
75th Percentile £75,000 £83,750 £80,000
90th Percentile £93,750 £96,250 £97,290
UK median annual salary £60,000 £70,000 £65,000
% change year-on-year -14.29% +7.69% +9.24%

All Software Libraries and Frameworks
Work from Home

REST falls under the Software Libraries and Frameworks category. For comparison with the information above, the following table provides summary statistics for all permanent job vacancies with remote or hybrid options requiring technical specification, industry standards, software libraries and framework skills.

Permanent vacancies with a requirement for technical specification, industry standards, software libraries and framework skills 7,187 10,711 34,988
As % of all permanent jobs with a WFH option 25.73% 32.64% 44.56%
Number of salaries quoted 5,753 8,589 17,752
10th Percentile £40,000 £41,450 £40,000
25th Percentile £47,500 £51,250 £47,000
Median annual salary (50th Percentile) £62,500 £65,351 £62,500
Median % change year-on-year -4.36% +4.56% +13.64%
75th Percentile £83,750 £85,000 £82,500
90th Percentile £117,500 £105,000 £95,000
UK median annual salary £60,000 £67,500 £65,000
% change year-on-year -11.11% +3.85% +13.04%

REST
Trend for Jobs with a WFH Option

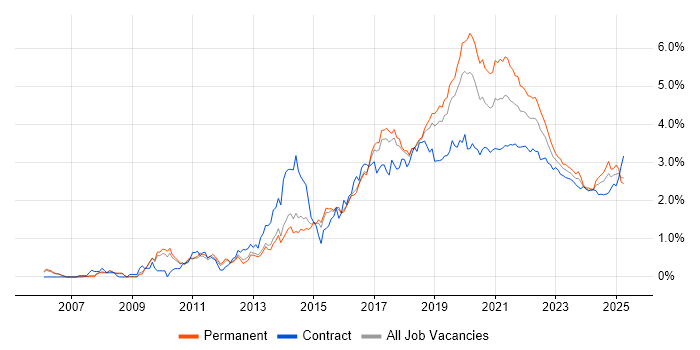
Job vacancies with a work from home option citing REST as a proportion of all IT jobs advertised.

REST trend for jobs with a WFH option

REST
Salary Trend for Jobs with a WFH Option

3-month moving average salary quoted in job vacancies with a work from home option citing REST.

REST salary trend for jobs with a WFH option

REST
Salary Histogram for Jobs with a WFH Option

Salary distribution for jobs with a work from home option citing REST over the 6 months to 26 July 2024.

REST salary histogram for jobs with a WFH option

REST
Co-occurring Skills and Capabilities with WFH Options by Category

The follow tables expand on the table above by listing co-occurrences grouped by category. The same employment type, locality and period is covered with up to 20 co-occurrences shown in each of the following categories:

Application Platforms
1 74 (13.24%) IIS
2 35 (6.26%) Apache
3 12 (2.15%) SharePoint
4 6 (1.07%) OpenStack
5 4 (0.72%) nginx
6 3 (0.54%) Apache Airflow
6 3 (0.54%) Confluence
6 3 (0.54%) JBoss
6 3 (0.54%) Microsoft Exchange
6 3 (0.54%) Red Hat Fuse
6 3 (0.54%) WordPress
7 2 (0.36%) CMS
7 2 (0.36%) Drupal
7 2 (0.36%) Moodle
7 2 (0.36%) Oracle Workflow
7 2 (0.36%) Tomcat
8 1 (0.18%) BizTalk Server
8 1 (0.18%) Kentico
8 1 (0.18%) SharePoint Server
8 1 (0.18%) WildFly
Applications
1 3 (0.54%) Trello
2 2 (0.36%) MS Visio
3 1 (0.18%) Microsoft Office
3 1 (0.18%) Notion
Business Applications
1 10 (1.79%) NEC Housing
2 3 (0.54%) Dynamics CRM
3 2 (0.36%) NetSuite
3 2 (0.36%) Sparx Enterprise Architect
4 1 (0.18%) Magento
4 1 (0.18%) Maximo
4 1 (0.18%) Oracle ERP
4 1 (0.18%) Payment Gateway
4 1 (0.18%) Shopify
Cloud Services
1 192 (34.35%) Azure
2 125 (22.36%) AWS
3 81 (14.49%) Azure DevOps
4 48 (8.59%) SaaS
5 28 (5.01%) Serverless
6 23 (4.11%) GCP
7 17 (3.04%) GitHub
7 17 (3.04%) Power Platform
8 16 (2.86%) Amazon EKS
9 15 (2.68%) Amazon ECS
10 10 (1.79%) Azure Functions
10 10 (1.79%) Azure Service Bus
10 10 (1.79%) Firebase
10 10 (1.79%) Nutanix
11 8 (1.43%) Entra ID
11 8 (1.43%) PaaS
12 7 (1.25%) Amazon SQS
12 7 (1.25%) Cloud Computing
12 7 (1.25%) Google Analytics
13 5 (0.89%) Amazon S3
Communications & Networking
1 52 (9.30%) DNS
2 43 (7.69%) Firewall
3 21 (3.76%) TCP/IP
4 19 (3.40%) SSL
5 14 (2.50%) HTTP
6 5 (0.89%) Broadband
6 5 (0.89%) Internet
7 3 (0.54%) iSCSI
7 3 (0.54%) LoRaWAN
7 3 (0.54%) SAN
7 3 (0.54%) Skype
7 3 (0.54%) VoIP
8 2 (0.36%) DHCP
8 2 (0.36%) DMZ
8 2 (0.36%) Fibre Channel
8 2 (0.36%) FTP
8 2 (0.36%) Modbus
8 2 (0.36%) VLAN
8 2 (0.36%) VPN
9 1 (0.18%) AMQP
Database & Business Intelligence
1 129 (23.08%) SQL Server
2 86 (15.38%) PostgreSQL
3 42 (7.51%) MongoDB
4 41 (7.33%) Relational Database
5 23 (4.11%) MySQL
5 23 (4.11%) NoSQL
6 21 (3.76%) Oracle Database
7 16 (2.86%) Amazon RDS
7 16 (2.86%) Redis
8 14 (2.50%) Elasticsearch
8 14 (2.50%) Power BI
9 9 (1.61%) Azure SQL Database
9 9 (1.61%) SQL Server Reporting Services
10 8 (1.43%) Data Warehouse
11 5 (0.89%) Amazon Aurora
11 5 (0.89%) SQL Server Integration Services
12 4 (0.72%) GIS
13 3 (0.54%) OLAP
13 3 (0.54%) RDBMS
13 3 (0.54%) Tableau
Development Applications
1 127 (22.72%) Git
2 49 (8.77%) Jenkins
3 33 (5.90%) Cucumber
4 31 (5.55%) Jasmine
4 31 (5.55%) Selenium
4 31 (5.55%) Visual Studio
5 30 (5.37%) JIRA
6 28 (5.01%) Karma Test Runner
6 28 (5.01%) Postman
7 21 (3.76%) Oracle APEX
8 13 (2.33%) Eclipse
8 13 (2.33%) JUnit
8 13 (2.33%) Octopus Deploy
9 12 (2.15%) TeamCity
10 9 (1.61%) Bitbucket
10 9 (1.61%) Cypress.io
10 9 (1.61%) IntelliJ
10 9 (1.61%) Team Foundation Server
10 9 (1.61%) TestNG
10 9 (1.61%) WebDriver
General
1 138 (24.69%) Social Skills
2 127 (22.72%) Finance
3 47 (8.41%) Analytical Skills
4 38 (6.80%) Law
5 35 (6.26%) Retail
6 34 (6.08%) Public Sector
7 15 (2.68%) Banking
8 14 (2.50%) Inclusion and Diversity
9 12 (2.15%) Marketing
10 10 (1.79%) Back Office
10 10 (1.79%) Legal
10 10 (1.79%) Local Government
10 10 (1.79%) Manufacturing
10 10 (1.79%) Pharmaceutical
10 10 (1.79%) Police
11 8 (1.43%) Advertising
12 6 (1.07%) Tech for Good
13 5 (0.89%) Telecoms
14 4 (0.72%) Financial Institution
14 4 (0.72%) Games
Job Titles
1 330 (59.03%) Developer
2 155 (27.73%) Senior
3 101 (18.07%) Senior Developer
4 57 (10.20%) .NET Developer
5 55 (9.84%) C# Developer
6 47 (8.41%) Lead
7 40 (7.16%) Software Engineer
8 39 (6.98%) Architect
9 28 (5.01%) Full Stack Developer
10 27 (4.83%) Software Developer
11 26 (4.65%) Java Developer
11 26 (4.65%) Lead Developer
12 25 (4.47%) Support Engineer
13 22 (3.94%) Software Support Engineer
14 21 (3.76%) C# .NET Developer
15 20 (3.58%) PHP Developer
16 18 (3.22%) Analyst
16 18 (3.22%) Python Engineer
16 18 (3.22%) Senior .NET Developer
17 15 (2.68%) Senior Java Developer
Libraries, Frameworks & Software Standards
1 210 (37.57%) .NET
2 167 (29.87%) Web Services
3 145 (25.94%) HTML
4 133 (23.79%) CSS
5 124 (22.18%) SOAP
6 121 (21.65%) JSON
7 104 (18.60%) AngularJS
7 104 (18.60%) ASP.NET
8 102 (18.25%) React
9 88 (15.74%) XML
10 58 (10.38%) GraphQL
10 58 (10.38%) jQuery
11 56 (10.02%) Kafka
12 53 (9.48%) RabbitMQ
13 43 (7.69%) gRPC
13 43 (7.69%) Twitter Bootstrap
13 43 (7.69%) Vue
14 38 (6.80%) HTML5
14 38 (6.80%) Sass
15 37 (6.62%) .NET Framework
Miscellaneous
1 29 (5.19%) Self-Motivation
2 24 (4.29%) Enterprise Software
3 18 (3.22%) Greenfield Project
4 16 (2.86%) Cloud Native
4 16 (2.86%) Product Ownership
5 15 (2.68%) Management Information System
6 14 (2.50%) IoT
7 13 (2.33%) NHS
8 12 (2.15%) Enterprise Cloud
9 11 (1.97%) Legacy Systems
10 10 (1.79%) Clustering
10 10 (1.79%) Hybrid Cloud
11 9 (1.61%) Client/Server
12 8 (1.43%) Data Structures
12 8 (1.43%) Distributed Systems
12 8 (1.43%) Mobile App
13 7 (1.25%) Algorithms
14 5 (0.89%) Blog
14 5 (0.89%) Derivative
14 5 (0.89%) Virtual Team
Operating Systems
1 60 (10.73%) Linux
2 56 (10.02%) Windows
3 27 (4.83%) AIX
4 22 (3.94%) Android
4 22 (3.94%) Apple iOS
5 13 (2.33%) Windows Server
6 4 (0.72%) Ubuntu
7 3 (0.54%) Unix
Processes & Methodologies
1 202 (36.14%) Agile
2 140 (25.04%) DevOps
3 126 (22.54%) Microservices
4 124 (22.18%) CI/CD
5 122 (21.82%) TDD
6 94 (16.82%) Problem-Solving
7 88 (15.74%) Software Engineering
8 77 (13.77%) MVC
9 73 (13.06%) Continuous Integration
10 68 (12.16%) BDD
11 66 (11.81%) Design Patterns
11 66 (11.81%) OO
11 66 (11.81%) Scrum
12 60 (10.73%) Mentoring
13 58 (10.38%) Full Stack Development
14 55 (9.84%) Computer Science
14 55 (9.84%) Test Automation
15 54 (9.66%) Unit Testing
16 48 (8.59%) Web Development
17 44 (7.87%) Regression Testing
Programming Languages
1 235 (42.04%) SQL
2 205 (36.67%) C#
3 190 (33.99%) JavaScript
4 136 (24.33%) Java
5 86 (15.38%) TypeScript
6 81 (14.49%) Python
7 54 (9.66%) T-SQL
8 50 (8.94%) VB
9 47 (8.41%) Go
10 46 (8.23%) VB.NET
11 37 (6.62%) PHP
11 37 (6.62%) PowerShell
12 33 (5.90%) C
13 28 (5.01%) VB6
14 27 (4.83%) C++
15 24 (4.29%) PL/SQL
16 19 (3.40%) Swift
16 19 (3.40%) XAML
17 18 (3.22%) Objective-C
18 12 (2.15%) Kotlin
Qualifications
1 59 (10.55%) Degree
2 49 (8.77%) Security Cleared
3 43 (7.69%) Computer Science Degree
4 33 (5.90%) SC Cleared
5 16 (2.86%) DBS Check
6 15 (2.68%) Azure Certification
7 4 (0.72%) DV Cleared
8 3 (0.54%) CIPD
8 3 (0.54%) Master's Degree
9 2 (0.36%) BPSS Clearance
9 2 (0.36%) CISM
9 2 (0.36%) CISSP
9 2 (0.36%) GIAC
9 2 (0.36%) ISO 27001 Lead Auditor
9 2 (0.36%) SANS
10 1 (0.18%) ACCA
10 1 (0.18%) Cisco Certification
10 1 (0.18%) Microsoft Certification
10 1 (0.18%) PMI Certification
10 1 (0.18%) VMware Certified Professional (VCP)
Quality Assurance & Compliance
1 68 (12.16%) QA
2 20 (3.58%) Accessibility
3 4 (0.72%) EMIR
3 4 (0.72%) GDPR
3 4 (0.72%) MiFID
3 4 (0.72%) NIST
4 3 (0.54%) ISO/IEC 27001
5 2 (0.36%) COBIT
5 2 (0.36%) ISO 9001
5 2 (0.36%) Web Application Security Consortium
6 1 (0.18%) SLA
System Software
1 118 (21.11%) Docker
2 17 (3.04%) Active Directory
3 15 (2.68%) Virtual Servers
4 10 (1.79%) VMware ESXi
4 10 (1.79%) VMware Infrastructure
5 7 (1.25%) Hyper-V
6 6 (1.07%) vSphere
7 5 (0.89%) Virtual Machines
8 2 (0.36%) Ceph
9 1 (0.18%) Varnish
Systems Management
1 67 (11.99%) Kubernetes
2 28 (5.01%) Terraform
3 24 (4.29%) Ansible
4 10 (1.79%) Failover Clustering
5 8 (1.43%) Nmap
6 5 (0.89%) Grafana
6 5 (0.89%) Packer
7 3 (0.54%) Argo
7 3 (0.54%) Consul
7 3 (0.54%) Microsoft Intune
8 2 (0.36%) Active Directory Federation Services
8 2 (0.36%) Computer Emergency Response Teams
8 2 (0.36%) Kustomize
8 2 (0.36%) N-central
8 2 (0.36%) Puppet
9 1 (0.18%) cPanel
9 1 (0.18%) Kibana
9 1 (0.18%) MIIS
9 1 (0.18%) Prometheus
Vendors
1 88 (15.74%) Microsoft
2 55 (9.84%) Oracle
3 22 (3.94%) Google
4 13 (2.33%) VMware
5 10 (1.79%) NEC
6 7 (1.25%) Salesforce
6 7 (1.25%) ServiceNow
7 6 (1.07%) WSO2
8 5 (0.89%) OpenAI
9 4 (0.72%) Citrix
9 4 (0.72%) Facebook
10 3 (0.54%) Cisco
10 3 (0.54%) Fortinet
10 3 (0.54%) IBM
10 3 (0.54%) Juniper
10 3 (0.54%) Mitel
10 3 (0.54%) Murex
10 3 (0.54%) SAP
10 3 (0.54%) Sophos
10 3 (0.54%) Sybase