SAP Jobs with Hybrid/Remote/WFH Options

SAP
UK > Work from Home

The table below provides summary statistics for permanent remote or hybrid work requiring knowledge or experience of SAP products and/or services. It includes a benchmarking guide to the annual salaries offered in vacancies that cited SAP over the 6 months leading up to 17 July 2025, comparing them to the same period in the previous two years.

The figures below represent the IT labour market in general and are not representative of salaries within SAP SE.

6 months to
17 Jul 2025
Same period 2024 Same period 2023
Rank 174 92 166
Rank change year-on-year -82 +74 +29
Permanent jobs citing SAP 410 991 718
As % of all permanent jobs with a WFH option 1.95% 3.13% 2.08%
As % of the Vendors category 3.88% 7.98% 5.27%
Number of salaries quoted 278 418 507
10th Percentile £45,000 £29,000 £40,000
25th Percentile £51,250 £41,250 £50,000
Median annual salary (50th Percentile) £65,000 £60,000 £62,500
Median % change year-on-year +8.33% -4.00% +8.70%
75th Percentile £80,938 £81,188 £77,911
90th Percentile £109,125 £95,000 £91,750
UK median annual salary £60,000 £60,000 £60,000
% change year-on-year - - +0.87%

All Vendors
Work from Home

SAP falls under the Vendor Products and Services category. For comparison with the information above, the following table provides summary statistics for all permanent job vacancies with a remote or hybrid options requiring knowledge or experience of all vendor products and services.

Permanent vacancies with a requirement for knowledge or experience of vendor products and services 10,572 12,416 13,621
As % of all permanent jobs with a WFH option 50.16% 39.15% 39.52%
Number of salaries quoted 5,169 8,508 10,003
10th Percentile £25,087 £31,250 £32,780
25th Percentile £30,500 £41,250 £43,750
Median annual salary (50th Percentile) £52,500 £55,000 £60,000
Median % change year-on-year -4.55% -8.33% +4.35%
75th Percentile £70,600 £72,500 £77,500
90th Percentile £90,000 £90,000 £92,500
UK median annual salary £50,000 £50,000 £57,500
% change year-on-year - -13.04% +4.55%

SAP
Trend for Jobs with a WFH Option

Job vacancies with remote working options citing SAP as a proportion of all IT jobs advertised.
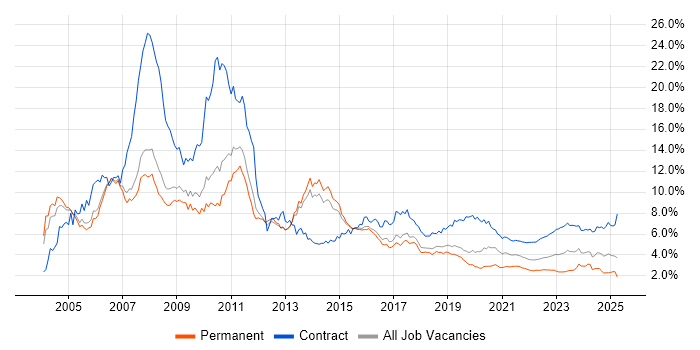
SAP trend for jobs with Hybrid/Remote/WFH options

SAP
Salary Trend for Jobs with a WFH Option

3-month moving average salary quoted in job vacancies with remote working options citing SAP.

SAP salary trend for jobs with a WFH option

SAP
Salary Histogram for Jobs with a WFH Option

Salary distribution for jobs with remote working options citing SAP over the 6 months to 17 July 2025.

SAP salary histogram for jobs with a WFH option

SAP
Co-occurring Skills and Capabilities with WFH Options by Category

The follow tables expand on the table above by listing co-occurrences grouped by category. The same employment type, locality and period is covered with up to 20 co-occurrences shown in each of the following categories:

Application Platforms
1 7 (1.71%) Confluence
2 4 (0.98%) Apache Spark
3 3 (0.73%) NetWeaver
4 1 (0.24%) Microsoft Exchange
4 1 (0.24%) OpenStack
Applications
1 60 (14.63%) Microsoft Excel
2 18 (4.39%) Microsoft Office
3 10 (2.44%) Microsoft Project
4 5 (1.22%) MS Visio
5 4 (0.98%) Microsoft PowerPoint
6 2 (0.49%) Spreadsheet
Business Applications
1 114 (27.80%) SAP S/4HANA
2 30 (7.32%) SAP HCM
2 30 (7.32%) SAP HR
3 26 (6.34%) SAP FI
3 26 (6.34%) SAP Payroll
4 22 (5.37%) SAP CO
4 22 (5.37%) SAP FI/CO
5 13 (3.17%) SAP PP
6 11 (2.68%) SAP SCM
7 10 (2.44%) NetSuite
7 10 (2.44%) Oracle EBS
8 7 (1.71%) SAP IBP
9 6 (1.46%) Salesforce CRM
9 6 (1.46%) SAP EWM
9 6 (1.46%) SAP SD
10 5 (1.22%) Infor M3
10 5 (1.22%) SAP BPC
10 5 (1.22%) SAP Oil and Gas
11 4 (0.98%) SAP MM
12 3 (0.73%) SAP APO
Cloud Services
1 50 (12.20%) Power Platform
2 44 (10.73%) Azure
3 43 (10.49%) SuccessFactors
4 37 (9.02%) AWS
5 15 (3.66%) GCP
6 10 (2.44%) Snowflake
7 7 (1.71%) Dynamics 365
7 7 (1.71%) SaaS
8 5 (1.22%) Azure Synapse Analytics
8 5 (1.22%) Boomi
8 5 (1.22%) Cloud Computing
9 4 (0.98%) Amazon EC2
9 4 (0.98%) Amazon S3
9 4 (0.98%) Azure Data Factory
9 4 (0.98%) Azure DevOps
9 4 (0.98%) iPaaS
9 4 (0.98%) Miro
10 3 (0.73%) Microsoft 365
10 3 (0.73%) OCI
10 3 (0.73%) Serverless
Communications & Networking
1 20 (4.88%) Network Security
2 6 (1.46%) Firewall
3 5 (1.22%) VPN
4 4 (0.98%) Ethernet
5 2 (0.49%) HTTP
5 2 (0.49%) RS-485
5 2 (0.49%) TCP/IP
6 1 (0.24%) Asterisk PBX
6 1 (0.24%) BGP
6 1 (0.24%) DNS
6 1 (0.24%) Intrusion Detection
6 1 (0.24%) LAN
6 1 (0.24%) OSPF
6 1 (0.24%) Profibus
6 1 (0.24%) RTP
6 1 (0.24%) Software-Defined Networking
6 1 (0.24%) SSL
6 1 (0.24%) VLAN
6 1 (0.24%) VoIP
6 1 (0.24%) Wireshark
Database & Business Intelligence
1 50 (12.20%) Power BI
2 22 (5.37%) SAP BW
3 16 (3.90%) Oracle Reports
4 15 (3.66%) Data Lake
5 12 (2.93%) Data Warehouse
6 10 (2.44%) BusinessObjects
7 9 (2.20%) Amazon Redshift
7 9 (2.20%) SAP HANA
8 8 (1.95%) Hadoop
8 8 (1.95%) MySQL
9 6 (1.46%) Big Data
9 6 (1.46%) SQL Server
9 6 (1.46%) Tableau
10 5 (1.22%) Amazon QuickSight
10 5 (1.22%) Metadata
11 4 (0.98%) Apache Hive
11 4 (0.98%) Azure SQL Data Warehouse
11 4 (0.98%) BigQuery
11 4 (0.98%) Enterprise Data Warehouse
12 3 (0.73%) Power Query
Development Applications
1 18 (4.39%) JIRA
2 4 (0.98%) Git
3 2 (0.49%) Jenkins
3 2 (0.49%) LSMW
3 2 (0.49%) Octopus Deploy
3 2 (0.49%) TeamCity
3 2 (0.49%) Vite
3 2 (0.49%) webpack
4 1 (0.24%) CMake
4 1 (0.24%) Fiddler
4 1 (0.24%) Oracle APEX
4 1 (0.24%) Oracle Forms
4 1 (0.24%) Subversion
4 1 (0.24%) WiX
General
1 203 (49.51%) Finance
2 161 (39.27%) Social Skills
3 111 (27.07%) Manufacturing
4 108 (26.34%) Analytical Skills
5 77 (18.78%) Public Sector
6 73 (17.80%) Marketing
7 64 (15.61%) Telecoms
8 61 (14.88%) Electronics
9 18 (4.39%) Inclusion and Diversity
10 14 (3.41%) Organisational Skills
11 11 (2.68%) Legal
12 10 (2.44%) Law
12 10 (2.44%) Presentation Skills
12 10 (2.44%) Retail
13 9 (2.20%) Documentation Skills
14 6 (1.46%) Banking
15 5 (1.22%) Pharmaceutical
16 4 (0.98%) Billing
16 4 (0.98%) Publishing
17 3 (0.73%) Finnish Language
Job Titles
1 87 (21.22%) Analyst
2 81 (19.76%) Consultant
3 52 (12.68%) Senior
4 51 (12.44%) SAP Consultant
5 42 (10.24%) Architect
6 39 (9.51%) Data Analyst
7 33 (8.05%) Project Manager
8 30 (7.32%) SAP Analyst
9 26 (6.34%) Procurement Analyst
10 25 (6.10%) SAP Architect
11 24 (5.85%) SAP Support
12 23 (5.61%) SAP Manager
13 22 (5.37%) Support Analyst
14 21 (5.12%) Lead
14 21 (5.12%) Security Consultant
15 20 (4.88%) Developer
15 20 (4.88%) SAP Support Analyst
16 18 (4.39%) Solutions Architect
17 17 (4.15%) Cybersecurity Consultant
18 14 (3.41%) SAP Solutions Architect
Libraries, Frameworks & Software Standards
1 42 (10.24%) SAP Fiori
2 17 (4.15%) REST
3 15 (3.66%) Middleware
4 14 (3.41%) SOAP
5 13 (3.17%) BAPI
6 11 (2.68%) OAuth
6 11 (2.68%) SAML
7 9 (2.20%) IBM Integration Bus
7 9 (2.20%) JMS
8 6 (1.46%) EDI
8 6 (1.46%) SAP PI
9 5 (1.22%) IDoc
9 5 (1.22%) SAPUI5
9 5 (1.22%) Web Services
10 4 (0.98%) HTML
10 4 (0.98%) Node.js
11 3 (0.73%) CSS
11 3 (0.73%) CSS3
11 3 (0.73%) HTML5
11 3 (0.73%) Vue
Miscellaneous
1 45 (10.98%) Management Information System
2 28 (6.83%) Enterprise Software
3 20 (4.88%) Analytical Mindset
3 20 (4.88%) PMI
4 13 (3.17%) IoT
5 11 (2.68%) Self-Motivation
6 10 (2.44%) Product Ownership
6 10 (2.44%) Virtual Team
7 8 (1.95%) Pricing Data
7 8 (1.95%) Renewable Energy
8 6 (1.46%) Legacy Systems
9 5 (1.22%) Cloud Native
9 5 (1.22%) Onboarding
9 5 (1.22%) Robotics
10 4 (0.98%) Algorithms
10 4 (0.98%) Derivative
10 4 (0.98%) FMCG
10 4 (0.98%) Life Science
11 3 (0.73%) Data Structures
11 3 (0.73%) Greenfield Project
Operating Systems
1 10 (2.44%) Linux
1 10 (2.44%) Windows
2 9 (2.20%) Windows Server
3 6 (1.46%) Unix
4 1 (0.24%) Robot Operating System
4 1 (0.24%) Solaris
4 1 (0.24%) Windows 10
4 1 (0.24%) Windows Server 2016
Processes & Methodologies
1 111 (27.07%) ERP
2 102 (24.88%) Problem-Solving
3 99 (24.15%) Business Intelligence
4 92 (22.44%) Agile
5 87 (21.22%) Process Improvement
6 74 (18.05%) Project Management
7 69 (16.83%) Programme Management
8 68 (16.59%) Stakeholder Management
9 64 (15.61%) Analytics
10 61 (14.88%) Data Analysis
10 61 (14.88%) Digital Marketing
11 58 (14.15%) Continuous Improvement
12 51 (12.44%) Visualisation
13 47 (11.46%) Data Management
14 46 (11.22%) Data Analytics
14 46 (11.22%) Migration
15 43 (10.49%) Mentoring
15 43 (10.49%) Roadmaps
16 42 (10.24%) Project Delivery
17 38 (9.27%) Decision-Making
Programming Languages
1 56 (13.66%) SQL
2 32 (7.80%) ABAP
3 23 (5.61%) Python
4 9 (2.20%) Java
4 9 (2.20%) VBA
5 6 (1.46%) PL/SQL
5 6 (1.46%) PowerShell
6 4 (0.98%) JavaScript
7 3 (0.73%) C#
7 3 (0.73%) C++
7 3 (0.73%) T-SQL
8 2 (0.49%) Bash
8 2 (0.49%) PHP
8 2 (0.49%) Shell Script
9 1 (0.24%) Apex Code
9 1 (0.24%) C
9 1 (0.24%) Perl
9 1 (0.24%) SAPscript
9 1 (0.24%) TypeScript
Qualifications
1 92 (22.44%) Degree
2 73 (17.80%) Security Cleared
3 29 (7.07%) Master's Degree
4 26 (6.34%) PMI Certification
5 25 (6.10%) DV Cleared
6 20 (4.88%) SAP Certification
6 20 (4.88%) SC Cleared
7 19 (4.63%) CISSP
8 18 (4.39%) CompTIA Security+
9 17 (4.15%) CEH
9 17 (4.15%) Computer Science Degree
10 15 (3.66%) ACCA
10 15 (3.66%) CIMA
11 11 (2.68%) Azure Certification
11 11 (2.68%) PMP
12 9 (2.20%) HNC
13 6 (1.46%) AWS Certification
14 5 (1.22%) CISA
15 4 (0.98%) GISP
15 4 (0.98%) Microsoft Certification
Quality Assurance & Compliance
1 38 (9.27%) Data Quality
2 27 (6.59%) GDPR
3 19 (4.63%) ISO/IEC 27001
4 18 (4.39%) NIST
5 17 (4.15%) PCI DSS
6 11 (2.68%) QA
7 10 (2.44%) PMO
8 9 (2.20%) Accessibility
9 8 (1.95%) IFRS
10 6 (1.46%) IFRS 9
11 5 (1.22%) ITGC
11 5 (1.22%) Sarbanes-Oxley
12 4 (0.98%) GxP
12 4 (0.98%) SLA
13 2 (0.49%) WCAG
14 1 (0.24%) GAAP
14 1 (0.24%) GMP
14 1 (0.24%) GRC
System Software
1 4 (0.98%) HDFS
1 4 (0.98%) IAG
2 3 (0.73%) Docker
3 2 (0.49%) Active Directory
4 1 (0.24%) Corosync
4 1 (0.24%) Embedded Firmware
4 1 (0.24%) Firmware
4 1 (0.24%) Hyper-V
4 1 (0.24%) Kamailio
4 1 (0.24%) KVM
4 1 (0.24%) VMware Infrastructure
4 1 (0.24%) vSphere
Systems Management
1 6 (1.46%) Single Sign-On
2 4 (0.98%) Kubernetes
2 4 (0.98%) Terraform
3 3 (0.73%) Ansible
4 1 (0.24%) Active Directory Federation Services
4 1 (0.24%) Data Guard
4 1 (0.24%) FortiGate
4 1 (0.24%) Grafana
4 1 (0.24%) Icinga
4 1 (0.24%) Microsoft Intune
4 1 (0.24%) Oracle ZFS
4 1 (0.24%) Pacemaker
4 1 (0.24%) Prometheus
4 1 (0.24%) Systems Management Server (SMS)
4 1 (0.24%) ZABBIX
Vendors
1 59 (14.39%) Oracle
2 54 (13.17%) Microsoft
3 18 (4.39%) Salesforce
3 18 (4.39%) Workday
4 17 (4.15%) Ariba
5 13 (3.17%) JD Edwards
6 12 (2.93%) Databricks
7 11 (2.68%) Concur
7 11 (2.68%) Google
7 11 (2.68%) IBM
8 10 (2.44%) Adaptive Insights
9 8 (1.95%) Teradata
10 5 (1.22%) Dell
10 5 (1.22%) Infor
11 3 (0.73%) Adobe
11 3 (0.73%) Anaplan
11 3 (0.73%) Epicor
11 3 (0.73%) Informatica
11 3 (0.73%) Sage
12 2 (0.49%) Palo Alto