Oracle Database Jobs with Work from Home Options

Oracle Database (Oracle RDBMS)
UK > Work from Home

The table below provides summary statistics for permanent remote or hybrid work requiring Oracle Database skills. It includes a benchmarking guide to the annual salaries offered in vacancies that cited Oracle Database over the 6 months leading up to 26 July 2024, comparing them to the same period in the previous two years.

6 months to
26 Jul 2024
Same period 2023 Same period 2022
Rank 357 308 503
Rank change year-on-year -49 +195 -112
Permanent jobs citing Oracle Database 186 315 471
As % of all permanent jobs with a WFH option 0.67% 0.96% 0.60%
As % of the Database & Business Intelligence category 3.16% 4.04% 2.04%
Number of salaries quoted 56 201 226
10th Percentile £46,306 £37,828 £40,000
25th Percentile £51,000 £39,294 £42,500
Median annual salary (50th Percentile) £62,500 £55,000 £56,500
Median % change year-on-year +13.64% -2.65% -0.88%
75th Percentile £75,625 £72,433 £68,438
90th Percentile £78,750 £82,548 £87,500
UK median annual salary £57,500 £55,000 £55,000
% change year-on-year +4.55% - +1.85%

All Database and Business Intelligence Skills
Work from Home

Oracle Database falls under the Databases and Business Intelligence category. For comparison with the information above, the following table provides summary statistics for all permanent job vacancies with remote or hybrid options requiring database or business intelligence skills.

Permanent vacancies with a requirement for database or business intelligence skills 5,877 7,799 23,130
As % of all permanent jobs with a WFH option 21.04% 23.76% 29.45%
Number of salaries quoted 4,479 6,085 11,274
10th Percentile £38,084 £40,000 £36,750
25th Percentile £46,250 £49,000 £45,000
Median annual salary (50th Percentile) £62,000 £62,500 £60,000
Median % change year-on-year -0.80% +4.17% +9.09%
75th Percentile £87,500 £80,000 £80,000
90th Percentile £122,500 £97,500 £95,000
UK median annual salary £60,000 £62,500 £60,000
% change year-on-year -4.00% +4.17% +9.09%

Oracle Database
Trend for Jobs with a WFH Option

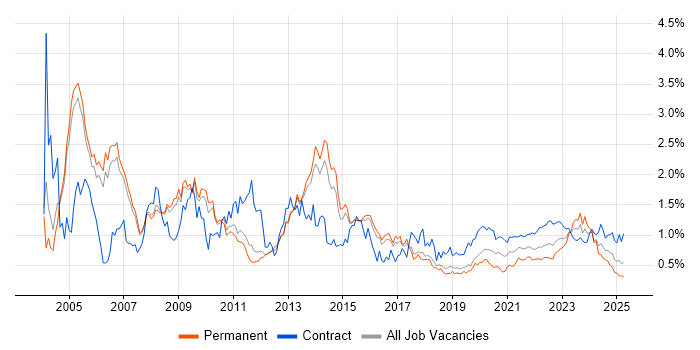
Job vacancies with a work from home option citing Oracle Database as a proportion of all IT jobs advertised.

Oracle Database trend for jobs with a WFH option

Oracle Database
Salary Trend for Jobs with a WFH Option

3-month moving average salary quoted in job vacancies with a work from home option citing Oracle Database.

Oracle Database salary trend for jobs with a WFH option

Oracle Database
Salary Histogram for Jobs with a WFH Option

Salary distribution for jobs with a work from home option citing Oracle Database over the 6 months to 26 July 2024.

Oracle Database salary histogram for jobs with a WFH option

Oracle Database
Co-occurring Skills and Capabilities with WFH Options by Category

The follow tables expand on the table above by listing co-occurrences grouped by category. The same employment type, locality and period is covered with up to 20 co-occurrences shown in each of the following categories:

Application Platforms
1 50 (26.88%) WebLogic
2 31 (16.67%) IIS
3 30 (16.13%) Apache
3 30 (16.13%) Tomcat
4 4 (2.15%) JBoss
5 3 (1.61%) GlassFish
6 2 (1.08%) Confluence
7 1 (0.54%) Camunda
7 1 (0.54%) nginx
7 1 (0.54%) Oracle Workflow
7 1 (0.54%) SharePoint
7 1 (0.54%) WebSphere
Applications
1 7 (3.76%) Microsoft Office
2 6 (3.23%) Microsoft Excel
3 2 (1.08%) MS Visio
4 1 (0.54%) Microsoft Project
Business Applications
1 46 (24.73%) Sparx Enterprise Architect
2 37 (19.89%) NEC Housing
Cloud Services
1 80 (43.01%) AWS
2 56 (30.11%) Azure
3 46 (24.73%) Amazon EKS
3 46 (24.73%) Amazon SQS
4 13 (6.99%) SaaS
5 8 (4.30%) Power Platform
6 4 (2.15%) GitHub
6 4 (2.15%) Microsoft 365
7 3 (1.61%) Amazon S3
7 3 (1.61%) AWS Lambda
7 3 (1.61%) Serverless
8 2 (1.08%) Azure Data Factory
8 2 (1.08%) Azure Logic Apps
8 2 (1.08%) Dynamics 365
8 2 (1.08%) GCP
8 2 (1.08%) OCI
8 2 (1.08%) OpenShift
9 1 (0.54%) Amazon CloudWatch
9 1 (0.54%) Apigee
9 1 (0.54%) AWS CloudFormation
Communications & Networking
1 50 (26.88%) DNS
2 46 (24.73%) BGP
2 46 (24.73%) SSL
2 46 (24.73%) TCP/IP
3 4 (2.15%) DHCP
4 3 (1.61%) Reverse Proxy
5 1 (0.54%) VPN
Database & Business Intelligence
1 51 (27.42%) RDBMS
1 51 (27.42%) Relational Database
2 49 (26.34%) Amazon RDS
3 28 (15.05%) PostgreSQL
4 26 (13.98%) Oracle Database 11g
5 19 (10.22%) SQL Server
6 9 (4.84%) MySQL
6 9 (4.84%) Oracle Database 12c
7 6 (3.23%) Power BI
8 5 (2.69%) Data Warehouse
8 5 (2.69%) Oracle Reports
8 5 (2.69%) SQL Server Integration Services
9 4 (2.15%) DB2
9 4 (2.15%) SAP HANA
10 3 (1.61%) BusinessObjects
10 3 (1.61%) Flink
10 3 (1.61%) SQLite
11 2 (1.08%) Oracle ODI
11 2 (1.08%) PowerCenter
11 2 (1.08%) SQL Server Reporting Services
Development Applications
1 22 (11.83%) Oracle APEX
2 5 (2.69%) Oracle Forms
3 4 (2.15%) JIRA
4 3 (1.61%) Jenkins
5 2 (1.08%) GitLab
5 2 (1.08%) Toad
6 1 (0.54%) Git
6 1 (0.54%) Gradle
6 1 (0.54%) IBM UrbanCode
6 1 (0.54%) Maven
6 1 (0.54%) Sonatype Nexus
6 1 (0.54%) Spinnaker
General
1 95 (51.08%) Social Skills
2 51 (27.42%) Finance
3 37 (19.89%) Local Government
3 37 (19.89%) Police
3 37 (19.89%) Public Sector
4 14 (7.53%) Analytical Skills
5 6 (3.23%) Back Office
6 5 (2.69%) Banking
6 5 (2.69%) Front Office
6 5 (2.69%) Law
7 3 (1.61%) Documentation Skills
7 3 (1.61%) Legal
7 3 (1.61%) Pharmaceutical
8 2 (1.08%) Presentation Skills
9 1 (0.54%) Games
9 1 (0.54%) Inclusion and Diversity
9 1 (0.54%) Manufacturing
Job Titles
1 58 (31.18%) Developer
2 48 (25.81%) Architect
2 48 (25.81%) Lead
3 47 (25.27%) Solutions Architect
4 46 (24.73%) Lead Architect
4 46 (24.73%) Lead Solutions Architect
5 33 (17.74%) Applications Support
6 27 (14.52%) Senior
7 26 (13.98%) Database Developer
8 25 (13.44%) PostgreSQL Developer
8 25 (13.44%) Senior Developer
9 18 (9.68%) DBA
10 15 (8.06%) Oracle Developer
11 13 (6.99%) Oracle DBA
11 13 (6.99%) Senior Database Developer
11 13 (6.99%) SQL Developer
12 12 (6.45%) Software Developer
13 11 (5.91%) PL/SQL Developer
14 10 (5.38%) Analyst
15 9 (4.84%) Support Analyst
Libraries, Frameworks & Software Standards
1 51 (27.42%) Spring Boot
2 46 (24.73%) RabbitMQ
3 28 (15.05%) Web Services
4 23 (12.37%) JSON
5 21 (11.29%) CSS
5 21 (11.29%) HTML
5 21 (11.29%) REST
6 11 (5.91%) jQuery
6 11 (5.91%) SOAP
6 11 (5.91%) XML
7 10 (5.38%) Ruby on Rails
8 6 (3.23%) Middleware
9 5 (2.69%) FIX Protocol
9 5 (2.69%) J2EE
9 5 (2.69%) Spring
10 4 (2.15%) Oracle ADF
10 4 (2.15%) Oracle Fusion
11 3 (1.61%) .NET
11 3 (1.61%) LDAP
11 3 (1.61%) SAML
Miscellaneous
1 78 (41.94%) Public Cloud
2 49 (26.34%) Enterprise Software
3 11 (5.91%) IoT
4 10 (5.38%) NHS
5 5 (2.69%) Onboarding
6 4 (2.15%) Clustering
7 3 (1.61%) Biopharmaceutical
7 3 (1.61%) Driving Licence
7 3 (1.61%) Learning Management System
7 3 (1.61%) Life Science
7 3 (1.61%) LIMS
7 3 (1.61%) Management Information System
8 2 (1.08%) Chip and PIN
9 1 (0.54%) Cloud Native
9 1 (0.54%) e-Learning
9 1 (0.54%) Linux Command Line
9 1 (0.54%) PKI
9 1 (0.54%) Replication
9 1 (0.54%) Robotics
9 1 (0.54%) Self-Motivation
Operating Systems
1 92 (49.46%) Linux
2 53 (28.49%) Windows
3 46 (24.73%) Red Hat Enterprise Linux
4 42 (22.58%) Unix
5 31 (16.67%) Solaris
6 11 (5.91%) Windows Server
7 7 (3.76%) AIX
8 1 (0.54%) VMS
8 1 (0.54%) Windows 10
8 1 (0.54%) Windows Server 2016
8 1 (0.54%) Windows Server 2019
Processes & Methodologies
1 84 (45.16%) Migration
2 82 (44.09%) Data Migration
3 73 (39.25%) Actionable Insight
4 54 (29.03%) Agile
5 50 (26.88%) Scrum
6 48 (25.81%) SDLC
7 47 (25.27%) Kanban
7 47 (25.27%) Project Management
7 47 (25.27%) Systems Engineering
8 46 (24.73%) ArchiMate
8 46 (24.73%) Cloud Operations
8 46 (24.73%) Collaborative Working
8 46 (24.73%) Load Balancing
8 46 (24.73%) Open Source
8 46 (24.73%) Re-Platforming
8 46 (24.73%) TOGAF
9 44 (23.66%) Performance Tuning
10 37 (19.89%) Data Security
11 31 (16.67%) Artificial Intelligence
12 30 (16.13%) Task Automation
Programming Languages
1 98 (52.69%) SQL
2 76 (40.86%) PL/SQL
3 27 (14.52%) Shell Script
4 25 (13.44%) Java
5 17 (9.14%) JavaScript
6 13 (6.99%) Python
7 10 (5.38%) C
7 10 (5.38%) Ruby
8 8 (4.30%) PowerShell
9 5 (2.69%) T-SQL
10 2 (1.08%) Bash
10 2 (1.08%) C#
11 1 (0.54%) Groovy
11 1 (0.54%) Lua
11 1 (0.54%) Scala
Qualifications
1 91 (48.92%) Security Cleared
2 52 (27.96%) SC Cleared
3 50 (26.88%) Degree
4 47 (25.27%) Azure Certification
5 46 (24.73%) AWS Certification
5 46 (24.73%) AWS Certified Solutions Architect
6 14 (7.53%) Computer Science Degree
7 10 (5.38%) DBS Check
8 5 (2.69%) OCP
8 5 (2.69%) Oracle Certification
9 2 (1.08%) DV Cleared
10 1 (0.54%) HNC
10 1 (0.54%) HND
10 1 (0.54%) MCSA
10 1 (0.54%) MCSE
10 1 (0.54%) Microsoft Certification
10 1 (0.54%) Microsoft Certified Architect
10 1 (0.54%) VMware Certified Professional (VCP)
Quality Assurance & Compliance
1 42 (22.58%) Accessibility
2 2 (1.08%) GDPR
2 2 (1.08%) QA
2 2 (1.08%) SLA
3 1 (0.54%) ISO/IEC 27001
3 1 (0.54%) ISO/IEC 27002 (supersedes ISO/IEC 17799)
3 1 (0.54%) NIST
System Software
1 9 (4.84%) Active Directory
2 4 (2.15%) Docker
3 2 (1.08%) VMware Infrastructure
4 1 (0.54%) Firmware
4 1 (0.54%) PowerHA
4 1 (0.54%) Veritas Cluster Server
4 1 (0.54%) VMware ESXi
4 1 (0.54%) vSphere
Systems Management
1 7 (3.76%) Oracle RMAN
2 5 (2.69%) Single Sign-On
3 3 (1.61%) Enterprise Manager Cloud Control
3 3 (1.61%) NetBackup
3 3 (1.61%) Oracle Enterprise Manager
3 3 (1.61%) Oracle Statspack
4 2 (1.08%) Kubernetes
4 2 (1.08%) Terraform
5 1 (0.54%) Ansible
5 1 (0.54%) Nagios
5 1 (0.54%) nmon
5 1 (0.54%) Progress Chef
5 1 (0.54%) Puppet
5 1 (0.54%) SCOM
5 1 (0.54%) SCOrch
5 1 (0.54%) vCenter Server
Vendors
1 186 (100.00%) Oracle
2 46 (24.73%) Microsoft
2 46 (24.73%) Sparx
3 37 (19.89%) NEC
4 5 (2.69%) Dynatrace
4 5 (2.69%) SAP
4 5 (2.69%) ServiceNow
5 4 (2.15%) SolarWinds
6 3 (1.61%) Adaptive Insights
6 3 (1.61%) Algorithmics
6 3 (1.61%) Anaplan
6 3 (1.61%) IBM
6 3 (1.61%) ION Trading
6 3 (1.61%) Ivanti
6 3 (1.61%) Jedox
6 3 (1.61%) New Relic
6 3 (1.61%) NGA Human Resources
6 3 (1.61%) Northgate
6 3 (1.61%) Tagetik
7 2 (1.08%) VMware