A/B Testing
UK
The table below provides summary statistics for contract job vacancies requiring A/B Testing skills. It includes a benchmarking guide to the contractor rates offered in vacancies that cited A/B Testing over the 6 months leading up to 30 April 2025, comparing them to the same period in the previous two years.
| 6 months to 30 Apr 2025 |
Same period 2024 | Same period 2023 | |
|---|---|---|---|
| Rank | 452 | 555 | 629 |
| Rank change year-on-year | +103 | +74 | +75 |
| Contract jobs citing A/B Testing | 67 | 45 | 84 |
| As % of all contract jobs advertised in the UK | 0.23% | 0.10% | 0.14% |
| As % of the Processes & Methodologies category | 0.25% | 0.12% | 0.16% |
| Number of daily rates quoted | 47 | 38 | 57 |
| 10th Percentile | £200 | £254 | £247 |
| 25th Percentile | £257 | £313 | £413 |
| Median daily rate (50th Percentile) | £420 | £444 | £500 |
| Median % change year-on-year | -5.35% | -11.25% | -4.76% |
| 75th Percentile | £525 | £542 | £613 |
| 90th Percentile | £585 | £605 | £675 |
| UK excluding London median daily rate | £363 | £500 | £502 |
| % change year-on-year | -27.50% | -0.40% | +0.40% |
All Process and Methodology Skills
UK
A/B Testing falls under the Processes and Methodologies category. For comparison with the information above, the following table provides summary statistics for all contract job vacancies requiring process or methodology skills.
| Contract vacancies with a requirement for process or methodology skills | 26,551 | 37,621 | 53,662 |
| As % of all contract IT jobs advertised in the UK | 90.82% | 86.30% | 89.91% |
| Number of daily rates quoted | 17,137 | 24,254 | 37,244 |
| 10th Percentile | £308 | £300 | £325 |
| 25th Percentile | £413 | £413 | £438 |
| Median daily rate (50th Percentile) | £521 | £525 | £550 |
| Median % change year-on-year | -0.86% | -4.55% | +4.76% |
| 75th Percentile | £630 | £638 | £650 |
| 90th Percentile | £744 | £750 | £750 |
| UK excluding London median daily rate | £481 | £500 | £500 |
| % change year-on-year | -3.80% | - | +5.26% |
| Number of hourly rates quoted | 1,071 | 2,437 | 1,746 |
| 10th Percentile | £14.70 | £12.75 | £11.00 |
| 25th Percentile | £18.50 | £16.00 | £16.25 |
| Median hourly rate | £29.00 | £35.50 | £37.30 |
| Median % change year-on-year | -18.31% | -4.83% | +49.20% |
| 75th Percentile | £62.00 | £59.95 | £65.00 |
| 90th Percentile | £75.00 | £72.50 | £75.00 |
| UK excluding London median hourly rate | £27.94 | £36.50 | £36.00 |
| % change year-on-year | -23.45% | +1.39% | +80.00% |
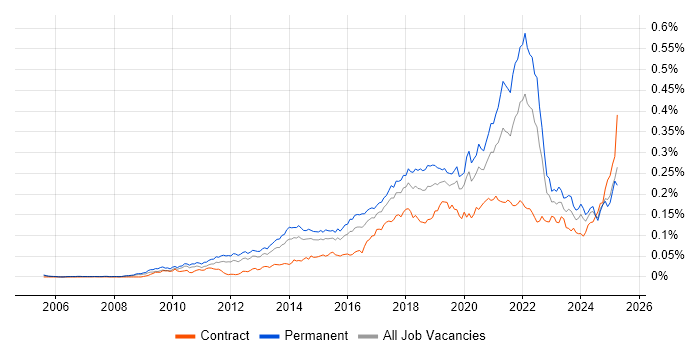
A/B Testing
Job Vacancy Trend
Job postings citing A/B Testing as a proportion of all IT jobs advertised.

A/B Testing
Contractor Daily Rate Trend
3-month moving average daily rate quoted in jobs citing A/B Testing.
A/B Testing
Daily Rate Histogram
Daily rate distribution for jobs citing A/B Testing over the 6 months to 30 April 2025.
A/B Testing
Contractor Hourly Rate Trend
3-month moving average hourly rates quoted in jobs citing A/B Testing.
A/B Testing
Top 14 Contract Locations
The table below looks at the demand and provides a guide to the median contractor rates quoted in IT jobs citing A/B Testing within the UK over the 6 months to 30 April 2025. The 'Rank Change' column provides an indication of the change in demand within each location based on the same 6 month period last year.
| Location | Rank Change on Same Period Last Year |
Matching Contract IT Job Ads |
Median Daily Rate Past 6 Months |
Median Daily Rate % Change on Same Period Last Year |
Live Jobs |
|---|---|---|---|---|---|
| England | +81 | 63 | £410 | -7.61% | 365 |
| London | +45 | 45 | £445 | -2.47% | 250 |
| UK excluding London | +69 | 21 | £363 | -27.50% | 121 |
| Work from Home | +58 | 17 | £445 | +18.67% | 184 |
| Midlands | +27 | 6 | £371 | -1.07% | 22 |
| North of England | - | 6 | £200 | - | 57 |
| South East | - | 5 | £363 | - | 15 |
| East Midlands | +12 | 4 | £371 | -1.07% | 7 |
| North East | - | 3 | £200 | - | 5 |
| North West | - | 3 | £257 | - | 44 |
| Scotland | - | 3 | £650 | - | 4 |
| West Midlands | +17 | 2 | £391 | -13.06% | 15 |
| South West | +45 | 1 | £500 | -23.08% | 13 |
| East of England | +32 | 1 | £463 | -15.91% | 9 |
A/B Testing
Co-occurring Skills and Capabilities by Category
The follow tables expand on the table above by listing co-occurrences grouped by category. The same employment type, locality and period is covered with up to 20 co-occurrences shown in each of the following categories:
|
|
||||||||||||||||||||||||||||||||||||||||||||||||||||||||||||||||||||||||||||||||||||||||||||||||||||||||||||||||||||||||||||||
|
|
||||||||||||||||||||||||||||||||||||||||||||||||||||||||||||||||||||||||||||||||||||||||||||||||||||||||||||||||||||||||||||||
|
|
||||||||||||||||||||||||||||||||||||||||||||||||||||||||||||||||||||||||||||||||||||||||||||||||||||||||||||||||||||||||||||||
|
|
||||||||||||||||||||||||||||||||||||||||||||||||||||||||||||||||||||||||||||||||||||||||||||||||||||||||||||||||||||||||||||||
|
|
||||||||||||||||||||||||||||||||||||||||||||||||||||||||||||||||||||||||||||||||||||||||||||||||||||||||||||||||||||||||||||||
|
|
||||||||||||||||||||||||||||||||||||||||||||||||||||||||||||||||||||||||||||||||||||||||||||||||||||||||||||||||||||||||||||||
|
|
||||||||||||||||||||||||||||||||||||||||||||||||||||||||||||||||||||||||||||||||||||||||||||||||||||||||||||||||||||||||||||||
|
|
||||||||||||||||||||||||||||||||||||||||||||||||||||||||||||||||||||||||||||||||||||||||||||||||||||||||||||||||||||||||||||||
|
|
||||||||||||||||||||||||||||||||||||||||||||||||||||||||||||||||||||||||||||||||||||||||||||||||||||||||||||||||||||||||||||||
|
|||||||||||||||||||||||||||||||||||||||||||||||||||||||||||||||||||||||||||||||||||||||||||||||||||||||||||||||||||||||||||||||
