GAP Analysis Jobs in England

GAP Analysis
UK > England

The table below provides summary statistics for permanent job vacancies advertised in England requiring GAP Analysis skills. It includes a benchmarking guide to the annual salaries offered in vacancies that cited GAP Analysis over the 6 months leading up to 28 May 2025, comparing them to the same period in the previous two years.

6 months to
28 May 2025
Same period 2024 Same period 2023
Rank 581 551 612
Rank change year-on-year -30 +61 +113
Permanent jobs citing GAP Analysis 102 302 320
As % of all permanent jobs advertised in England 0.21% 0.34% 0.37%
As % of the Processes & Methodologies category 0.22% 0.41% 0.38%
Number of salaries quoted 55 223 204
10th Percentile £46,178 £38,750 £41,250
25th Percentile £52,500 £45,000 £47,500
Median annual salary (50th Percentile) £60,000 £61,500 £60,000
Median % change year-on-year -2.44% +2.50% -
75th Percentile £78,750 £80,000 £90,000
90th Percentile £91,250 £95,000 £103,375
UK median annual salary £60,000 £62,500 £60,000
% change year-on-year -4.00% +4.17% -

All Process and Methodology Skills
England

GAP Analysis falls under the Processes and Methodologies category. For comparison with the information above, the following table provides summary statistics for all permanent job vacancies requiring process or methodology skills in England.

Permanent vacancies with a requirement for process or methodology skills 45,477 74,482 83,229
As % of all permanent jobs advertised in England 94.01% 84.24% 95.56%
Number of salaries quoted 22,533 54,432 49,691
10th Percentile £29,625 £29,000 £34,375
25th Percentile £41,250 £40,000 £46,105
Median annual salary (50th Percentile) £57,500 £55,000 £62,500
Median % change year-on-year +4.55% -12.00% +4.17%
75th Percentile £75,000 £72,500 £82,500
90th Percentile £98,695 £93,750 £102,500
UK median annual salary £57,500 £55,000 £61,000
% change year-on-year +4.55% -9.84% +1.67%

GAP Analysis
Job Vacancy Trend in England

Job postings citing GAP Analysis as a proportion of all IT jobs advertised in England.
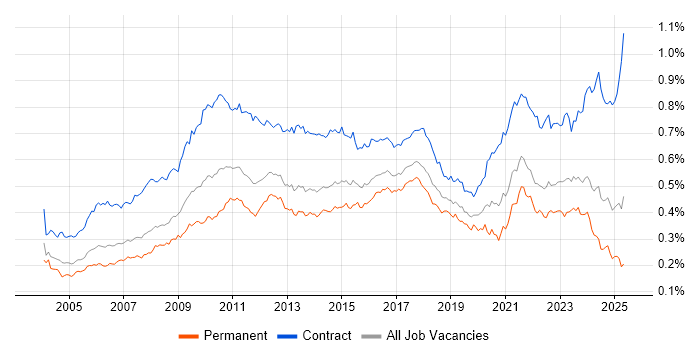
Job vacancy trend for GAP Analysis in England

GAP Analysis
Salary Trend in England

3-month moving average salary quoted in jobs citing GAP Analysis in England.

Salary trend for GAP Analysis in England

GAP Analysis
Salary Histogram in England

Salary distribution for jobs citing GAP Analysis in England over the 6 months to 28 May 2025.

Salary histogram for GAP Analysis in England

GAP Analysis
Job Locations in England

The table below looks at the demand and provides a guide to the median salaries quoted in IT jobs citing GAP Analysis within the England region over the 6 months to 28 May 2025. The 'Rank Change' column provides an indication of the change in demand within each location based on the same 6 month period last year.

Location Rank Change
on Same Period
Last Year
Matching
Permanent
IT Job Ads
Median Salary
Past 6 Months
Median Salary
% Change
on Same Period
Last Year
Live
Jobs
South East +92 29 £55,000 +4.76% 23
London +49 29 £72,500 - 91
Midlands +14 17 £64,500 +35.79% 14
East Midlands +25 15 £49,000 +0.64% 2
North of England -15 11 £78,750 +75.00% 23
South West +112 10 £48,894 +12.40% 11
North West -30 9 £87,500 +94.44% 13
East of England +41 3 £63,000 +20.00% 8
Yorkshire +50 2 £60,000 -2.04% 9
West Midlands +31 1 £100,000 +116.22% 12
GAP Analysis
UK

GAP Analysis
Co-occurring Skills and Capabilities in England by Category

The follow tables expand on the table above by listing co-occurrences grouped by category. The same employment type, locality and period is covered with up to 20 co-occurrences shown in each of the following categories:

Application Platforms
1 6 (5.88%) CMS
1 6 (5.88%) Sitecore CMS
2 3 (2.94%) Confluence
2 3 (2.94%) SharePoint
3 2 (1.96%) Oracle Workflow
4 1 (0.98%) Apache
4 1 (0.98%) Apache Airflow
4 1 (0.98%) Microsoft Exchange
4 1 (0.98%) SharePoint Server
Applications
1 10 (9.80%) Microsoft Excel
2 9 (8.82%) Microsoft PowerPoint
3 4 (3.92%) Microsoft Office
3 4 (3.92%) MS Visio
4 2 (1.96%) Adobe XD
4 2 (1.96%) Oracle Smart View
4 2 (1.96%) Spreadsheet
5 1 (0.98%) Camtasia
5 1 (0.98%) Revit
Business Applications
1 7 (6.86%) Dynamics AX
2 4 (3.92%) Dynamics CRM
2 4 (3.92%) ResourceLink
3 2 (1.96%) Oracle Assets
3 2 (1.96%) Oracle Cash Management
3 2 (1.96%) Oracle ERP
3 2 (1.96%) Oracle Financials
3 2 (1.96%) Oracle General Ledger
3 2 (1.96%) Oracle Payables
3 2 (1.96%) Oracle Receivables
4 1 (0.98%) Elite 3E
4 1 (0.98%) SAP EWM
4 1 (0.98%) SAP Oil and Gas
4 1 (0.98%) SAP S/4HANA
4 1 (0.98%) SAP SD
Cloud Services
1 17 (16.67%) Dynamics 365
2 15 (14.71%) Azure
3 9 (8.82%) Power Platform
4 6 (5.88%) Google Analytics
5 5 (4.90%) AWS
5 5 (4.90%) SaaS
6 4 (3.92%) Azure DevOps
6 4 (3.92%) Microsoft 365
7 3 (2.94%) OCI
8 2 (1.96%) Azure Functions
8 2 (1.96%) Azure Logic Apps
8 2 (1.96%) Azure Service Bus
8 2 (1.96%) Figma
8 2 (1.96%) PaaS
8 2 (1.96%) PowerApps
8 2 (1.96%) Serverless
9 1 (0.98%) GCP
9 1 (0.98%) OneDrive
9 1 (0.98%) Power Automate
9 1 (0.98%) Salesforce Service Cloud
Communications & Networking
1 3 (2.94%) Firewall
2 1 (0.98%) DNS
Database & Business Intelligence
1 6 (5.88%) Power BI
2 5 (4.90%) Tableau
3 1 (0.98%) BigQuery
3 1 (0.98%) Data Warehouse
3 1 (0.98%) Snowflake Schema
Development Applications
1 4 (3.92%) JIRA
General
1 33 (32.35%) Finance
1 33 (32.35%) Social Skills
2 20 (19.61%) Analytical Skills
3 12 (11.76%) Inclusion and Diversity
4 9 (8.82%) Law
4 9 (8.82%) Legal
4 9 (8.82%) Marketing
4 9 (8.82%) Presentation Skills
5 8 (7.84%) Advertising
5 8 (7.84%) Retail
6 7 (6.86%) Publishing
7 5 (4.90%) Influencing Skills
7 5 (4.90%) Public Sector
8 4 (3.92%) Documentation Skills
9 3 (2.94%) Banking
9 3 (2.94%) German Language
10 2 (1.96%) Billing
10 2 (1.96%) General Ledger
10 2 (1.96%) Local Government
10 2 (1.96%) Manufacturing
Job Titles
1 24 (23.53%) Analyst
2 18 (17.65%) Business Analyst
3 15 (14.71%) Consultant
4 14 (13.73%) Lead
5 10 (9.80%) Functional Consultant
5 10 (9.80%) Project Engineer
6 9 (8.82%) Electrical Engineer
7 8 (7.84%) Cybersecurity Engineer
7 8 (7.84%) Security Engineer
7 8 (7.84%) Senior
8 7 (6.86%) Architect
8 7 (6.86%) Dynamics 365 Consultant
8 7 (6.86%) Information Officer
8 7 (6.86%) Risk Officer
9 6 (5.88%) Digital Executive
9 6 (5.88%) Senior Analyst
9 6 (5.88%) SEO Executive
10 5 (4.90%) Senior Business Analyst
11 4 (3.92%) MI Manager
11 4 (3.92%) Security Analyst
Libraries, Frameworks & Software Standards
1 4 (3.92%) REST
2 3 (2.94%) Oracle Fusion
3 2 (1.96%) CSS
3 2 (1.96%) HTML
3 2 (1.96%) SOAP
4 1 (0.98%) Middleware
4 1 (0.98%) SAP Fiori
4 1 (0.98%) Web Services
Miscellaneous
1 20 (19.61%) Management Information System
2 11 (10.78%) Product Ownership
3 9 (8.82%) Security Posture
4 8 (7.84%) Self-Motivation
5 7 (6.86%) Data Protection Act
6 6 (5.88%) Analytical Mindset
6 6 (5.88%) Blog
7 4 (3.92%) Legacy Systems
8 2 (1.96%) Legacy Applications
8 2 (1.96%) Onboarding
8 2 (1.96%) SWIFT Messaging Network
9 1 (0.98%) Data Structures
9 1 (0.98%) Greenfield Project
9 1 (0.98%) Hybrid Cloud
9 1 (0.98%) iPhone
9 1 (0.98%) Learning Management System
9 1 (0.98%) Life Science
9 1 (0.98%) OTC Derivatives
9 1 (0.98%) Renewable Energy
9 1 (0.98%) Wiki
Operating Systems
1 2 (1.96%) Windows
1 2 (1.96%) Windows 10
2 1 (0.98%) Android
2 1 (0.98%) Apple iOS
2 1 (0.98%) Mac OS
2 1 (0.98%) Windows Server
2 1 (0.98%) Windows Server 2016
2 1 (0.98%) Windows Server 2019
Processes & Methodologies
1 25 (24.51%) Agile
2 20 (19.61%) Project Management
3 19 (18.63%) Analytics
3 19 (18.63%) Performance Management
3 19 (18.63%) Requirements Gathering
4 18 (17.65%) Data Modelling
4 18 (17.65%) Stakeholder Management
5 17 (16.67%) Business Analysis
5 17 (16.67%) Cybersecurity
6 16 (15.69%) Migration
7 14 (13.73%) Project Delivery
7 14 (13.73%) Risk Management
7 14 (13.73%) Roadmaps
7 14 (13.73%) Supply Chain Management
7 14 (13.73%) User Acceptance Testing
8 13 (12.75%) Business Intelligence
8 13 (12.75%) Data Migration
8 13 (12.75%) Information Security
9 12 (11.76%) Problem-Solving
9 12 (11.76%) Workshop Facilitation
Programming Languages
1 6 (5.88%) SQL
2 2 (1.96%) JavaScript
3 1 (0.98%) PowerShell
3 1 (0.98%) Python
3 1 (0.98%) VB
3 1 (0.98%) VBScript
Qualifications
1 14 (13.73%) Degree
2 11 (10.78%) CISSP
3 9 (8.82%) HND
4 8 (7.84%) CISM
4 8 (7.84%) CRISC
5 7 (6.86%) Microsoft Certification
5 7 (6.86%) Network+ Certification
6 6 (5.88%) MCP
6 6 (5.88%) Security Cleared
7 3 (2.94%) CCSK
7 3 (2.94%) SC Cleared
8 2 (1.96%) AWS Certification
8 2 (1.96%) AWS Certified Cloud Practitioner
8 2 (1.96%) AWS Certified Solutions Architect
8 2 (1.96%) CBAP
8 2 (1.96%) CTC Cleared
8 2 (1.96%) IIBA
9 1 (0.98%) Cisco Certification
9 1 (0.98%) CISMP
9 1 (0.98%) Six Sigma Green Belt
Quality Assurance & Compliance
1 19 (18.63%) ISO/IEC 27001
2 14 (13.73%) Cyber Essentials
2 14 (13.73%) Cyber Essentials PLUS
3 9 (8.82%) GDPR
4 8 (7.84%) ISO/IEC 27002 (supersedes ISO/IEC 17799)
5 5 (4.90%) NIST
6 4 (3.92%) Data Quality
7 3 (2.94%) PCI DSS
8 2 (1.96%) GRC
8 2 (1.96%) PMO
9 1 (0.98%) ISO 20022
9 1 (0.98%) ISO 22301
9 1 (0.98%) ISO 9001
9 1 (0.98%) MiFID
9 1 (0.98%) NCSC
9 1 (0.98%) QA
System Software
1 1 (0.98%) Active Directory
1 1 (0.98%) BitLocker
1 1 (0.98%) Microsoft App-V
1 1 (0.98%) Virtual Desktop
1 1 (0.98%) VMware Infrastructure
Systems Management
1 1 (0.98%) Active Directory Federation Services
1 1 (0.98%) Microsoft Intune
1 1 (0.98%) Nessus
1 1 (0.98%) SCCM
Vendors
1 33 (32.35%) Microsoft
2 7 (6.86%) Google
2 7 (6.86%) Salesforce
3 6 (5.88%) Ahrefs
3 6 (5.88%) SAP
3 6 (5.88%) Screaming Frog
3 6 (5.88%) Sitecore
4 4 (3.92%) Cognos
5 3 (2.94%) Intel
5 3 (2.94%) Oracle
6 2 (1.96%) Adobe
7 1 (0.98%) Atlassian
7 1 (0.98%) Fortinet
7 1 (0.98%) GoldenSource
7 1 (0.98%) Informatica
7 1 (0.98%) McAfee
7 1 (0.98%) Sophos
7 1 (0.98%) Symantec
7 1 (0.98%) Talend
7 1 (0.98%) VMware