PowerApps Jobs in England

Microsoft Power Apps
UK > England

The following table provides summary statistics for permanent job vacancies advertised in England with a requirement for PowerApps skills. Included is a benchmarking guide to the salaries offered in vacancies that have cited PowerApps over the 6 months to 27 April 2024 with a comparison to the same period in the previous 2 years.

6 months to
27 Apr 2024
Same period 2023 Same period 2022
Rank 296 398 563
Rank change year-on-year +102 +165 -136
Permanent jobs citing PowerApps 802 750 721
As % of all permanent jobs advertised in England 0.95% 0.80% 0.55%
As % of the Cloud Services category 2.66% 1.85% 1.15%
Number of salaries quoted 620 557 549
10th Percentile £36,365 £37,500 £33,700
25th Percentile £44,536 £50,000 £41,250
Median annual salary (50th Percentile) £57,500 £62,500 £55,000
Median % change year-on-year -8.00% +13.64% -8.33%
75th Percentile £68,750 £75,000 £65,750
90th Percentile £80,750 £86,250 £78,750
UK median annual salary £55,000 £62,182 £55,000
% change year-on-year -11.55% +13.06% -8.33%

All Cloud Skills
England

PowerApps is in the Cloud Services category. The following table is for comparison with the above and provides summary statistics for all permanent job vacancies advertised in England with a requirement for cloud computing skills.

Permanent vacancies with a requirement for cloud computing skills 30,147 40,514 62,567
As % of all permanent jobs advertised in England 35.55% 43.46% 47.86%
Number of salaries quoted 24,141 26,748 37,125
10th Percentile £30,000 £34,777 £33,750
25th Percentile £41,250 £46,250 £45,000
Median annual salary (50th Percentile) £57,500 £65,000 £62,500
Median % change year-on-year -11.54% +4.00% +4.17%
75th Percentile £77,500 £85,000 £83,750
90th Percentile £97,500 £103,750 £100,000
UK median annual salary £57,500 £65,000 £62,500
% change year-on-year -11.54% +4.00% +8.70%

PowerApps
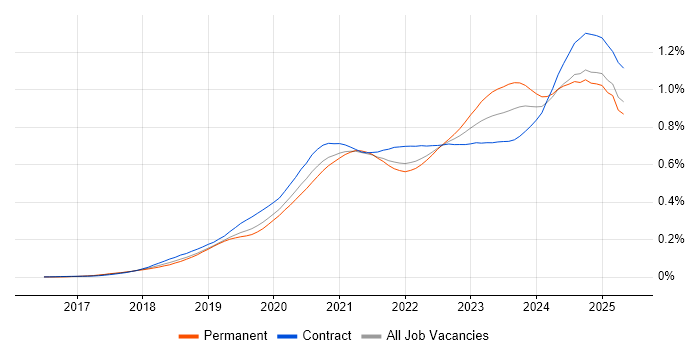
Job Vacancy Trend in England

Job postings citing PowerApps as a proportion of all IT jobs advertised in England.

Job vacancy trend for PowerApps in England

PowerApps
Salary Trend in England

3-month moving average salary quoted in jobs citing PowerApps in England.

Salary trend for PowerApps in England

PowerApps
Salary Histogram in England

Salary distribution for jobs citing PowerApps in England over the 6 months to 27 April 2024.

Salary histogram for PowerApps in England

PowerApps
Job Locations in England

The table below looks at the demand and provides a guide to the median salaries quoted in IT jobs citing PowerApps within the England region over the 6 months to 27 April 2024. The 'Rank Change' column provides an indication of the change in demand within each location based on the same 6 month period last year.

Location Rank Change
on Same Period
Last Year
Matching
Permanent
IT Job Ads
Median Salary
Past 6 Months
Median Salary
% Change
on Same Period
Last Year
Live
Jobs
London +76 279 £62,500 -9.09% 78
North of England +74 143 £50,000 -8.90% 35
Midlands +84 132 £59,000 +12.17% 28
South East +73 114 £55,000 +10.00% 30
West Midlands +84 105 £62,500 +18.82% 22
South West +11 82 £46,958 -0.09% 15
Yorkshire +80 66 £52,500 -4.55% 13
North West +36 59 £47,500 -8.65% 18
East of England +26 35 £52,500 -38.24% 7
East Midlands +8 27 £51,000 -11.30% 6
North East +11 18 £45,000 +11.11% 4
PowerApps
UK

PowerApps
Co-occurring Skills and Capabilities in England by Category

The follow tables expand on the table above by listing co-occurrences grouped by category. The same employment type, locality and period is covered with up to 20 co-occurrences shown in each of the following categories:

Application Platforms
1 253 (31.55%) SharePoint
2 57 (7.11%) Microsoft Exchange
3 9 (1.12%) Apache Spark
4 8 (1.00%) Confluence
5 3 (0.37%) Apache Airflow
6 2 (0.25%) Apache
6 2 (0.25%) CMS
6 2 (0.25%) IIS
6 2 (0.25%) Umbraco
7 1 (0.12%) SharePoint 2010
Applications
1 49 (6.11%) Microsoft Excel
1 49 (6.11%) Microsoft Office
2 18 (2.24%) Microsoft PowerPoint
3 9 (1.12%) MS Visio
4 2 (0.25%) Trello
5 1 (0.12%) Adobe Creative Suite
Business Applications
1 146 (18.20%) Dynamics CRM
2 11 (1.37%) Dynamics AX
3 6 (0.75%) Primavera
4 4 (0.50%) Dynamics NAV
5 2 (0.25%) BusinessWorks
Cloud Services
1 791 (98.63%) Power Platform
2 536 (66.83%) Power Automate
3 422 (52.62%) Azure
4 320 (39.90%) Microsoft 365
5 260 (32.42%) Dynamics 365
6 85 (10.60%) Azure DevOps
6 85 (10.60%) Azure Logic Apps
7 64 (7.98%) Serverless
8 61 (7.61%) Entra ID
9 60 (7.48%) Azure Functions
10 38 (4.74%) OneDrive
11 36 (4.49%) Azure Service Bus
12 25 (3.12%) AWS
13 23 (2.87%) Azure Data Factory
14 20 (2.49%) Azure Synapse Analytics
14 20 (2.49%) SaaS
15 19 (2.37%) ShareGate
16 17 (2.12%) Cloud Computing
17 16 (2.00%) GCP
18 11 (1.37%) Azure WebJobs
Communications & Networking
1 26 (3.24%) Intranet
2 9 (1.12%) DHCP
2 9 (1.12%) DNS
3 6 (0.75%) Network Security
4 4 (0.50%) HTTP
5 3 (0.37%) Extranet
5 3 (0.37%) Firewall
5 3 (0.37%) VPN
6 2 (0.25%) Remote Desktop
6 2 (0.25%) TCP/IP
6 2 (0.25%) VLAN
7 1 (0.12%) Cisco IOS
7 1 (0.12%) IP Telephony
7 1 (0.12%) LAN
7 1 (0.12%) SSL
7 1 (0.12%) Unified Communications
7 1 (0.12%) WAN
7 1 (0.12%) Wi-Fi
Database & Business Intelligence
1 466 (58.10%) Power BI
2 105 (13.09%) SQL Server
3 46 (5.74%) Data Lake
4 43 (5.36%) SQL Server Reporting Services
5 42 (5.24%) Azure SQL Database
6 38 (4.74%) Power Query
7 24 (2.99%) SQL Server Integration Services
8 23 (2.87%) Tableau
9 21 (2.62%) Data Warehouse
10 20 (2.49%) Relational Database
10 20 (2.49%) SQL Server Analysis Services
11 12 (1.50%) NoSQL
12 10 (1.25%) Big Data
13 7 (0.87%) Data Mining
13 7 (0.87%) Spark SQL
14 5 (0.62%) BigQuery
14 5 (0.62%) EDMS
14 5 (0.62%) Hadoop
15 4 (0.50%) PowerPivot
15 4 (0.50%) Snowflake Schema
Development Applications
1 25 (3.12%) Git
2 18 (2.24%) Visual Studio
3 11 (1.37%) JIRA
4 10 (1.25%) gulp
4 10 (1.25%) Yeoman
5 7 (0.87%) SQL Server Management Studio (SSMS)
6 6 (0.75%) Visual Studio Code
6 6 (0.75%) Visual Studio Team System
7 3 (0.37%) Octopus Deploy
7 3 (0.37%) SpecFlow
8 2 (0.25%) MSTest
8 2 (0.25%) NUnit
9 1 (0.12%) Selenium
9 1 (0.12%) Sourcetree
9 1 (0.12%) Team Foundation Server
General
1 252 (31.42%) Social Skills
2 142 (17.71%) Finance
3 94 (11.72%) Analytical Skills
4 88 (10.97%) Law
5 76 (9.48%) Marketing
6 66 (8.23%) Public Sector
7 51 (6.36%) Legal
8 40 (4.99%) Manufacturing
9 39 (4.86%) Fire and Rescue
10 36 (4.49%) Inclusion and Diversity
11 33 (4.11%) Organisational Skills
12 30 (3.74%) Retail
13 19 (2.37%) Pharmaceutical
14 14 (1.75%) Presentation Skills
15 12 (1.50%) Automotive
15 12 (1.50%) Banking
16 11 (1.37%) General Ledger
17 10 (1.25%) Police
18 9 (1.12%) Influencing Skills
19 8 (1.00%) Documentation Skills
Job Titles
1 368 (45.89%) Developer
2 141 (17.58%) Power Platform Developer
3 109 (13.59%) Senior
4 88 (10.97%) Architect
5 84 (10.47%) Lead
6 80 (9.98%) Senior Developer
7 71 (8.85%) Dynamics 365 Developer
8 68 (8.48%) Applications Developer
9 66 (8.23%) Consultant
10 59 (7.36%) Analyst
11 51 (6.36%) Power Platform Architect
12 42 (5.24%) Platform Architect
13 41 (5.11%) Solutions Architect
14 38 (4.74%) Power Apps Developer
14 38 (4.74%) Senior Dynamics 365 Developer
15 33 (4.11%) Lead Developer
16 31 (3.87%) SharePoint Developer
17 28 (3.49%) Power BI Developer
17 28 (3.49%) Technical Architect
18 27 (3.37%) Dynamics 365 Consultant
Libraries, Frameworks & Software Standards
1 146 (18.20%) .NET
2 72 (8.98%) HTML5 Canvas
3 69 (8.60%) HTML
4 48 (5.99%) CSS
5 46 (5.74%) JSON
6 31 (3.87%) ASP.NET
7 28 (3.49%) React
8 27 (3.37%) .NET Framework
9 23 (2.87%) .NET Core
10 21 (2.62%) Web Services
11 19 (2.37%) RESTful
12 15 (1.87%) Entity Framework
13 13 (1.62%) SPFx
14 12 (1.50%) ASP.NET MVC
14 12 (1.50%) Microsoft Graph
14 12 (1.50%) PySpark
15 10 (1.25%) AngularJS
15 10 (1.25%) Node.js
16 9 (1.12%) XML
17 8 (1.00%) ASP.NET Web API
Miscellaneous
1 73 (9.10%) Low-Code
2 25 (3.12%) Onboarding
3 22 (2.74%) Enterprise Software
4 21 (2.62%) Product Ownership
5 16 (2.00%) Enterprise Cloud
6 14 (1.75%) Data Structures
6 14 (1.75%) Virtual Team
7 10 (1.25%) IoT
8 8 (1.00%) Hybrid Cloud
9 7 (0.87%) Analytical Mindset
9 7 (0.87%) Biopharmaceutical
9 7 (0.87%) Foreign Exchange (FX)
9 7 (0.87%) Legacy Applications
9 7 (0.87%) Management Information System
10 6 (0.75%) Cloud Native
10 6 (0.75%) Greenfield Project
10 6 (0.75%) Industrial Internet of Things
10 6 (0.75%) Industry 4.0
10 6 (0.75%) PMI
10 6 (0.75%) Virtual Reality
Operating Systems
1 33 (4.11%) Windows
2 21 (2.62%) Windows Server
3 9 (1.12%) Windows Server 2016
4 8 (1.00%) Windows Server 2012
5 7 (0.87%) Linux
5 7 (0.87%) Windows Server 2019
6 4 (0.50%) Windows 10
7 1 (0.12%) Android
7 1 (0.12%) Mac OS
7 1 (0.12%) VMS
Processes & Methodologies
1 430 (53.62%) Business Intelligence
2 273 (34.04%) Agile
3 183 (22.82%) DevOps
4 173 (21.57%) CRM
5 143 (17.83%) Problem-Solving
6 107 (13.34%) Scrum
7 103 (12.84%) User Experience
8 98 (12.22%) Analytics
9 94 (11.72%) Customer Service
9 94 (11.72%) Data Modelling
10 93 (11.60%) Artificial Intelligence
11 80 (9.98%) Workflow
12 79 (9.85%) ITIL
13 71 (8.85%) Project Management
14 62 (7.73%) Project Delivery
15 61 (7.61%) Migration
15 61 (7.61%) Translating Business Requirements
16 60 (7.48%) Visualisation
17 58 (7.23%) Service Delivery
18 57 (7.11%) Decision-Making
Programming Languages
1 219 (27.31%) SQL
2 168 (20.95%) C#
3 153 (19.08%) JavaScript
4 69 (8.60%) PowerShell
5 56 (6.98%) Python
6 49 (6.11%) TypeScript
7 44 (5.49%) Java
8 30 (3.74%) Data Analysis Expressions
9 21 (2.62%) T-SQL
10 10 (1.25%) Formula Language
11 9 (1.12%) R
12 6 (0.75%) Bash
13 5 (0.62%) MATLAB
14 3 (0.37%) C++
14 3 (0.37%) Scala
15 2 (0.25%) PHP
15 2 (0.25%) PL/SQL
15 2 (0.25%) VB.NET
16 1 (0.12%) C
16 1 (0.12%) VBA
Qualifications
1 166 (20.70%) Degree
2 79 (9.85%) Microsoft Certification
3 47 (5.86%) Security Cleared
4 45 (5.61%) Computer Science Degree
5 32 (3.99%) SC Cleared
6 22 (2.74%) Azure Certification
7 18 (2.24%) Master's Degree
8 11 (1.37%) ITIL Certification
9 6 (0.75%) CIMA
9 6 (0.75%) MCSE
9 6 (0.75%) PMI Certification
10 4 (0.50%) CIPD
11 3 (0.37%) MCP
12 2 (0.25%) DV Cleared
13 1 (0.12%) A+ Certification
13 1 (0.12%) AWS Certification
13 1 (0.12%) DBS Check
13 1 (0.12%) Network+ Certification
Quality Assurance & Compliance
1 24 (2.99%) Data Quality
2 22 (2.74%) QA
3 11 (1.37%) SLA
4 8 (1.00%) Accessibility
4 8 (1.00%) PMO
5 7 (0.87%) ISO/IEC 27001
6 3 (0.37%) GDPR
System Software
1 71 (8.85%) Active Directory
2 15 (1.87%) VMware Infrastructure
3 14 (1.75%) Hyper-V
4 4 (0.50%) Docker
5 3 (0.37%) Virtual Machines
6 1 (0.12%) Virtual Desktop
6 1 (0.12%) VMware ESXi
Systems Management
1 26 (3.24%) Microsoft Intune
2 10 (1.25%) Active Directory Federation Services
3 7 (0.87%) Kubernetes
4 6 (0.75%) WSUS
5 3 (0.37%) HP Fortify
6 2 (0.25%) Single Sign-On
6 2 (0.25%) Terraform
7 1 (0.12%) Jamf Pro
7 1 (0.12%) vMotion
Vendors
1 632 (78.80%) Microsoft
2 24 (2.99%) iManage
3 20 (2.49%) Databricks
4 18 (2.24%) VMware
5 14 (1.75%) Citrix
6 13 (1.62%) Aderant
6 13 (1.62%) Oracle
6 13 (1.62%) ServiceNow
7 12 (1.50%) Nintex
8 11 (1.37%) OpenAI
9 10 (1.25%) Google
9 10 (1.25%) SAP
10 7 (0.87%) Salesforce
11 6 (0.75%) Sun
12 5 (0.62%) Automation Anywhere
13 4 (0.50%) DocuSign
13 4 (0.50%) Facebook
13 4 (0.50%) Twitter
14 3 (0.37%) Cisco
14 3 (0.37%) Sitecore