PaaS Jobs in England

Platform as a Service (PaaS)
UK > England

The table below provides summary statistics for permanent job vacancies advertised in England requiring PaaS skills. It includes a benchmarking guide to the annual salaries offered in vacancies that cited PaaS over the 6 months leading up to 1 May 2025, comparing them to the same period in the previous two years.

6 months to
1 May 2025
Same period 2024 Same period 2023
Rank 337 314 179
Rank change year-on-year -23 -135 +12
Permanent jobs citing PaaS 368 752 1,911
As % of all permanent jobs advertised in England 0.80% 0.88% 2.07%
As % of the Cloud Services category 2.68% 2.48% 4.76%
Number of salaries quoted 235 629 1,074
10th Percentile £44,000 £46,250 £42,500
25th Percentile £55,625 £56,219 £53,916
Median annual salary (50th Percentile) £72,500 £70,073 £70,000
Median % change year-on-year +3.46% +0.10% -2.29%
75th Percentile £92,500 £90,000 £90,000
90th Percentile £111,250 £110,000 £105,000
UK median annual salary £71,991 £72,500 £70,000
% change year-on-year -0.70% +3.57% -

All Cloud Skills
England

PaaS falls under the Cloud Services category. For comparison with the information above, the following table provides summary statistics for all permanent job vacancies requiring cloud computing skills in England.

Permanent vacancies with a requirement for cloud computing skills 13,738 30,311 40,119
As % of all permanent jobs advertised in England 29.83% 35.58% 43.36%
Number of salaries quoted 10,184 24,258 26,546
10th Percentile £31,250 £30,000 £34,750
25th Percentile £44,277 £41,250 £46,250
Median annual salary (50th Percentile) £62,500 £57,500 £65,000
Median % change year-on-year +8.70% -11.54% +4.00%
75th Percentile £83,750 £77,500 £85,000
90th Percentile £105,000 £97,500 £105,000
UK median annual salary £61,000 £57,500 £65,000
% change year-on-year +6.09% -11.54% +4.00%

PaaS
Job Vacancy Trend in England

Job postings citing PaaS as a proportion of all IT jobs advertised in England.
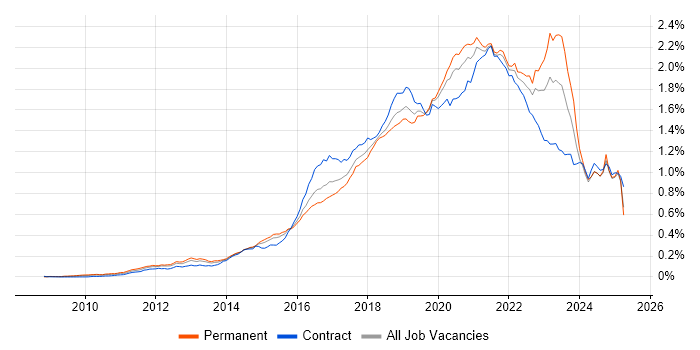
Job vacancy trend for PaaS in England

PaaS
Salary Trend in England

3-month moving average salary quoted in jobs citing PaaS in England.

Salary trend for PaaS in England

PaaS
Salary Histogram in England

Salary distribution for jobs citing PaaS in England over the 6 months to 1 May 2025.

Salary histogram for PaaS in England

PaaS
Job Locations in England

The table below looks at the demand and provides a guide to the median salaries quoted in IT jobs citing PaaS within the England region over the 6 months to 1 May 2025. The 'Rank Change' column provides an indication of the change in demand within each location based on the same 6 month period last year.

Location Rank Change
on Same Period
Last Year
Matching
Permanent
IT Job Ads
Median Salary
Past 6 Months
Median Salary
% Change
on Same Period
Last Year
Live
Jobs
London -23 161 £85,000 - 140
South East +93 77 £70,000 +12.00% 73
Midlands +45 46 £70,000 +7.69% 41
North of England +16 37 £65,000 +8.33% 49
West Midlands +10 33 £70,000 +1.11% 28
South West +39 25 £71,991 +2.84% 26
North West -10 22 £75,000 +13.21% 28
East Midlands +56 13 £36,250 -19.44% 10
Yorkshire +52 13 £62,500 +5.00% 18
East of England +56 12 £50,000 -16.67% 19
North East +46 2 - - 4
PaaS
UK

PaaS
Co-occurring Skills and Capabilities in England by Category

The follow tables expand on the table above by listing co-occurrences grouped by category. The same employment type, locality and period is covered with up to 20 co-occurrences shown in each of the following categories:

Application Platforms
1 44 (11.96%) SharePoint
2 22 (5.98%) Microsoft Exchange
3 18 (4.89%) CMS
4 7 (1.90%) Oracle SOA Suite
4 7 (1.90%) Tomcat
5 6 (1.63%) IIS
6 5 (1.36%) NetWeaver
7 4 (1.09%) Apache
7 4 (1.09%) Apache Spark
8 2 (0.54%) BizTalk Server
8 2 (0.54%) Confluence
8 2 (0.54%) OpenStack
8 2 (0.54%) Oracle Workflow
9 1 (0.27%) Apache Airflow
9 1 (0.27%) Ethereum
Applications
1 8 (2.17%) Microsoft Excel
1 8 (2.17%) MS Visio
2 2 (0.54%) Maya
2 2 (0.54%) Oracle Smart View
2 2 (0.54%) Spreadsheet
Business Applications
1 12 (3.26%) PeopleSoft HCM
2 7 (1.90%) Oracle EBS
3 5 (1.36%) Oracle Subledger Accounting
4 3 (0.82%) Dynamics CRM
4 3 (0.82%) SAP Hybris
5 2 (0.54%) Aladdin
5 2 (0.54%) Oracle Assets
5 2 (0.54%) Oracle Cash Management
5 2 (0.54%) Oracle ERP
5 2 (0.54%) Oracle Financials
5 2 (0.54%) Oracle General Ledger
5 2 (0.54%) Oracle Payables
5 2 (0.54%) Oracle Receivables
5 2 (0.54%) thinkFolio
Cloud Services
1 282 (76.63%) Azure
2 212 (57.61%) SaaS
3 182 (49.46%) IaaS
4 88 (23.91%) AWS
5 86 (23.37%) Azure DevOps
6 52 (14.13%) Microsoft 365
7 44 (11.96%) GCP
8 35 (9.51%) Entra ID
9 34 (9.24%) GitHub
10 25 (6.79%) OCI
10 25 (6.79%) Serverless
11 22 (5.98%) GitHub Actions
12 20 (5.43%) Power Platform
13 19 (5.16%) Azure Data Factory
14 16 (4.35%) iPaaS
15 14 (3.80%) Azure ExpressRoute
15 14 (3.80%) Azure Service Bus
16 13 (3.53%) Azure Cosmos DB
16 13 (3.53%) Azure Logic Apps
16 13 (3.53%) PowerApps
Communications & Networking
1 26 (7.07%) Firewall
2 25 (6.79%) DNS
3 19 (5.16%) VPN
4 18 (4.89%) DHCP
5 15 (4.08%) Network Security
6 12 (3.26%) SAN
7 11 (2.99%) WAN
8 10 (2.72%) Cisco IOS
9 8 (2.17%) FTP
9 8 (2.17%) IPv4
9 8 (2.17%) PBX
9 8 (2.17%) SMTP
9 8 (2.17%) Structured Cabling
9 8 (2.17%) VLAN
10 7 (1.90%) LAN
11 6 (1.63%) SD-WAN
11 6 (1.63%) TCP/IP
12 4 (1.09%) IPsec
12 4 (1.09%) Wi-Fi
13 3 (0.82%) VoIP
Database & Business Intelligence
1 27 (7.34%) SQL Server
2 16 (4.35%) Power BI
3 15 (4.08%) Data Warehouse
4 12 (3.26%) Data Lake
4 12 (3.26%) SQL Server Reporting Services
5 11 (2.99%) Azure SQL Database
5 11 (2.99%) SQL Server Integration Services
6 9 (2.45%) Star Schema
7 8 (2.17%) Amazon RDS
8 7 (1.90%) BigQuery
9 6 (1.63%) Big Data
9 6 (1.63%) MongoDB
9 6 (1.63%) MySQL
10 5 (1.36%) BusinessObjects
10 5 (1.36%) Oracle ODI
10 5 (1.36%) PostgreSQL
10 5 (1.36%) SAP BW
10 5 (1.36%) SAP Data Services
10 5 (1.36%) SAP HANA
11 4 (1.09%) NoSQL
Development Applications
1 26 (7.07%) Jenkins
2 22 (5.98%) Git
3 9 (2.45%) SQL Server Management Studio (SSMS)
4 8 (2.17%) Oracle Forms
4 8 (2.17%) SonarQube
5 7 (1.90%) JIRA
6 5 (1.36%) GitLab
7 2 (0.54%) Gradle
7 2 (0.54%) Maven
7 2 (0.54%) Octopus Deploy
7 2 (0.54%) Oracle APEX
8 1 (0.27%) CircleCI
8 1 (0.27%) Vagrant
General
1 139 (37.77%) Finance
2 122 (33.15%) Social Skills
3 52 (14.13%) Analytical Skills
4 35 (9.51%) Public Sector
5 33 (8.97%) Law
6 32 (8.70%) Presentation Skills
7 25 (6.79%) Banking
7 25 (6.79%) Legal
8 24 (6.52%) Organisational Skills
8 24 (6.52%) Telecoms
9 23 (6.25%) Marketing
10 13 (3.53%) Retail
11 7 (1.90%) General Ledger
11 7 (1.90%) Inclusion and Diversity
11 7 (1.90%) Police
12 6 (1.63%) Advertising
12 6 (1.63%) Influencing Skills
13 5 (1.36%) Front Office
13 5 (1.36%) Manufacturing
14 3 (0.82%) Games
Job Titles
1 86 (23.37%) Senior
2 69 (18.75%) Architect
3 56 (15.22%) Cloud Engineer
4 52 (14.13%) Azure Engineer
5 40 (10.87%) Lead
6 34 (9.24%) Developer
7 33 (8.97%) Infrastructure Engineer
8 32 (8.70%) Senior Cloud Engineer
8 32 (8.70%) Solutions Architect
9 24 (6.52%) Security Engineer
10 22 (5.98%) Platform Engineer
11 21 (5.71%) IT Architect
12 19 (5.16%) DevOps Engineer
13 15 (4.08%) Applications Architect
14 14 (3.80%) Data Architect
15 12 (3.26%) Azure Infrastructure Engineer
15 12 (3.26%) Consultant
15 12 (3.26%) Oracle Specialist
15 12 (3.26%) Senior Developer
16 11 (2.99%) Cloud Infrastructure Engineer
Libraries, Frameworks & Software Standards
1 39 (10.60%) .NET
2 20 (5.43%) React
3 18 (4.89%) .NET Framework
3 18 (4.89%) Node.js
4 17 (4.62%) YAML
5 13 (3.53%) ARM Templates
6 12 (3.26%) REST
7 10 (2.72%) Web Services
8 9 (2.45%) AngularJS
8 9 (2.45%) SOAP
9 8 (2.17%) Azure Blueprints
10 7 (1.90%) HTML
10 7 (1.90%) RESTful
11 6 (1.63%) CSS
11 6 (1.63%) Middleware
11 6 (1.63%) React Native
11 6 (1.63%) SAML
12 5 (1.36%) JSON
12 5 (1.36%) Oracle Fusion
13 4 (1.09%) OAuth
Miscellaneous
1 47 (12.77%) Management Information System
2 37 (10.05%) Public Cloud
3 25 (6.79%) Cloud Native
3 25 (6.79%) Hybrid Cloud
4 19 (5.16%) Security Posture
5 16 (4.35%) Greenfield Project
6 13 (3.53%) Blockchain
6 13 (3.53%) Onboarding
6 13 (3.53%) Private Cloud
7 10 (2.72%) Data Centre
8 9 (2.45%) Driving Licence
9 8 (2.17%) Enterprise Cloud
9 8 (2.17%) Product Ownership
10 6 (1.63%) DataPower
10 6 (1.63%) PKI
10 6 (1.63%) Replication
11 5 (1.36%) Clustering
11 5 (1.36%) Enterprise Software
11 5 (1.36%) Virtual Team
12 4 (1.09%) Cyber Kill Chain
Operating Systems
1 65 (17.66%) Windows
2 47 (12.77%) Linux
3 38 (10.33%) Windows Server
4 14 (3.80%) Android
5 11 (2.99%) Red Hat Enterprise Linux
6 9 (2.45%) Windows 10
7 8 (2.17%) Unix
8 6 (1.63%) Apple iOS
9 5 (1.36%) AIX
9 5 (1.36%) Windows Server 2016
9 5 (1.36%) Windows Server 2019
10 4 (1.09%) VMS
11 3 (0.82%) Windows Server 2008
11 3 (0.82%) Windows Server 2012
12 2 (0.54%) SUSE
12 2 (0.54%) Ubuntu
Processes & Methodologies
1 164 (44.57%) DevOps
2 131 (35.60%) Agile
3 122 (33.15%) CI/CD
4 82 (22.28%) Infrastructure as Code
5 69 (18.75%) Mentoring
6 61 (16.58%) Problem-Solving
7 52 (14.13%) Coaching
8 50 (13.59%) Cybersecurity
9 49 (13.32%) Analytics
9 49 (13.32%) Cloud Security
10 48 (13.04%) Computer Science
11 42 (11.41%) High Availability
11 42 (11.41%) Infrastructure Engineering
11 42 (11.41%) Migration
11 42 (11.41%) Platform Engineering
12 41 (11.14%) DevSecOps
12 41 (11.14%) Roadmaps
12 41 (11.14%) Test Automation
13 35 (9.51%) Artificial Intelligence
13 35 (9.51%) Creative Thinking
Programming Languages
1 79 (21.47%) PowerShell
2 73 (19.84%) Python
3 52 (14.13%) SQL
4 25 (6.79%) C#
4 25 (6.79%) JavaScript
5 22 (5.98%) Bash
6 21 (5.71%) Java
7 16 (4.35%) Bicep
8 7 (1.90%) TypeScript
9 6 (1.63%) C
10 4 (1.09%) Ruby
11 3 (0.82%) Data Analysis Expressions
11 3 (0.82%) Go
12 2 (0.54%) Apex Code
12 2 (0.54%) C++
12 2 (0.54%) PHP
12 2 (0.54%) Rust
12 2 (0.54%) SOQL
12 2 (0.54%) T-SQL
13 1 (0.27%) Kotlin
Qualifications
1 75 (20.38%) Degree
2 33 (8.97%) Azure Certification
2 33 (8.97%) Security Cleared
3 27 (7.34%) Microsoft Certification
4 21 (5.71%) SC Cleared
5 20 (5.43%) Computer Science Degree
5 20 (5.43%) Master's Degree
6 17 (4.62%) CCNA
6 17 (4.62%) Cisco Certification
7 9 (2.45%) AWS Certification
7 9 (2.45%) CCNP
8 8 (2.17%) BPSS Clearance
8 8 (2.17%) Network+ Certification
9 7 (1.90%) CISSP
10 6 (1.63%) MCSE
11 5 (1.36%) MCP
11 5 (1.36%) MCSA
12 4 (1.09%) AWS Certified Solutions Architect
12 4 (1.09%) MBA
13 3 (0.82%) GSEC
Quality Assurance & Compliance
1 28 (7.61%) NIST
2 27 (7.34%) ISO/IEC 27001
3 24 (6.52%) NCSC
4 15 (4.08%) Data Quality
5 14 (3.80%) GDPR
6 8 (2.17%) QA
7 5 (1.36%) Cyber Essentials
8 4 (1.09%) ISO/IEC 27002 (supersedes ISO/IEC 17799)
9 3 (0.82%) HIPAA
10 2 (0.54%) Accessibility
10 2 (0.54%) Cyber Essentials PLUS
11 1 (0.27%) GRC
System Software
1 44 (11.96%) Active Directory
2 38 (10.33%) VMware Infrastructure
3 32 (8.70%) Docker
4 17 (4.62%) Virtual Desktop
5 15 (4.08%) VMware ESXi
6 14 (3.80%) Hyper-V
7 6 (1.63%) Virtual Machines
8 2 (0.54%) HDFS
8 2 (0.54%) vSphere
9 1 (0.27%) Firmware
9 1 (0.27%) VMware NSX
Systems Management
1 80 (21.74%) Terraform
2 49 (13.32%) Kubernetes
3 40 (10.87%) Ansible
4 25 (6.79%) Microsoft Intune
5 12 (3.26%) SCCM
6 9 (2.45%) WSUS
7 5 (1.36%) Tivoli Storage Manager
8 3 (0.82%) Active Directory Federation Services
9 2 (0.54%) CASB
9 2 (0.54%) Grafana
9 2 (0.54%) Hadoop YARN
9 2 (0.54%) Host Intrusion Detection System
9 2 (0.54%) Progress Chef
9 2 (0.54%) Puppet
9 2 (0.54%) SCOM
9 2 (0.54%) vCenter Server
10 1 (0.27%) Consul
10 1 (0.27%) FortiGate
10 1 (0.27%) Prometheus
10 1 (0.27%) Salt
Vendors
1 132 (35.87%) Microsoft
2 46 (12.50%) VMware
3 38 (10.33%) Oracle
4 27 (7.34%) Cisco
5 24 (6.52%) IBM
6 22 (5.98%) Citrix
7 21 (5.71%) Databricks
8 17 (4.62%) Red Hat
9 14 (3.80%) Google
10 12 (3.26%) PeopleSoft
11 9 (2.45%) SAP
11 9 (2.45%) Veeam
12 7 (1.90%) Salesforce
13 6 (1.63%) Apple
13 6 (1.63%) Palo Alto
14 5 (1.36%) EMC
15 4 (1.09%) Aruba
15 4 (1.09%) Dell
15 4 (1.09%) Fortinet
15 4 (1.09%) Rapid7