BMC Control-M
UK
The table below provides summary statistics for contract job vacancies requiring Control-M skills. It includes a benchmarking guide to the contractor rates offered in vacancies that cited Control-M over the 6 months leading up to 13 July 2025, comparing them to the same period in the previous two years.
| 6 months to 13 Jul 2025 |
Same period 2024 | Same period 2023 | |
|---|---|---|---|
| Rank | 517 | 549 | 623 |
| Rank change year-on-year | +32 | +74 | +162 |
| Contract jobs citing Control-M | 31 | 44 | 51 |
| As % of all contract jobs advertised in the UK | 0.095% | 0.10% | 0.090% |
| As % of the Systems Management category | 0.60% | 0.81% | 0.59% |
| Number of daily rates quoted | 21 | 31 | 41 |
| 10th Percentile | £488 | £375 | £418 |
| 25th Percentile | £510 | £419 | £494 |
| Median daily rate (50th Percentile) | £630 | £475 | £600 |
| Median % change year-on-year | +32.63% | -20.83% | +14.29% |
| 75th Percentile | £710 | £571 | £688 |
| 90th Percentile | £738 | £625 | £740 |
| UK excluding London median daily rate | £538 | £475 | £425 |
| % change year-on-year | +13.16% | +11.76% | -16.67% |
| Number of hourly rates quoted | 4 | 0 | 0 |
| 10th Percentile | - | - | - |
| 25th Percentile | £20.25 | - | - |
| Median hourly rate | £20.50 | - | - |
| 75th Percentile | £20.75 | - | - |
| 90th Percentile | - | - | - |
| UK excluding London median hourly rate | £20.50 | - | - |
All Systems Management Skills
UK
Control-M falls under the Systems Management category. For comparison with the information above, the following table provides summary statistics for all contract job vacancies requiring systems management skills.
| Contract vacancies with a requirement for systems management skills | 5,135 | 5,439 | 8,640 |
| As % of all contract IT jobs advertised in the UK | 15.69% | 12.72% | 15.32% |
| Number of daily rates quoted | 3,397 | 3,844 | 6,110 |
| 10th Percentile | £300 | £300 | £350 |
| 25th Percentile | £409 | £413 | £460 |
| Median daily rate (50th Percentile) | £508 | £519 | £550 |
| Median % change year-on-year | -2.26% | -5.59% | -4.35% |
| 75th Percentile | £600 | £622 | £675 |
| 90th Percentile | £700 | £700 | £750 |
| UK excluding London median daily rate | £492 | £500 | £525 |
| % change year-on-year | -1.60% | -4.76% | +2.94% |
| Number of hourly rates quoted | 71 | 101 | 184 |
| 10th Percentile | £13.75 | £16.79 | £18.65 |
| 25th Percentile | £20.25 | £22.08 | £25.71 |
| Median hourly rate | £37.50 | £32.50 | £57.50 |
| Median % change year-on-year | +15.38% | -43.48% | +148.76% |
| 75th Percentile | £63.58 | £50.00 | £73.75 |
| 90th Percentile | £77.50 | £71.25 | £84.63 |
| UK excluding London median hourly rate | £57.00 | £40.00 | £46.09 |
| % change year-on-year | +42.50% | -13.21% | +130.45% |
Control-M
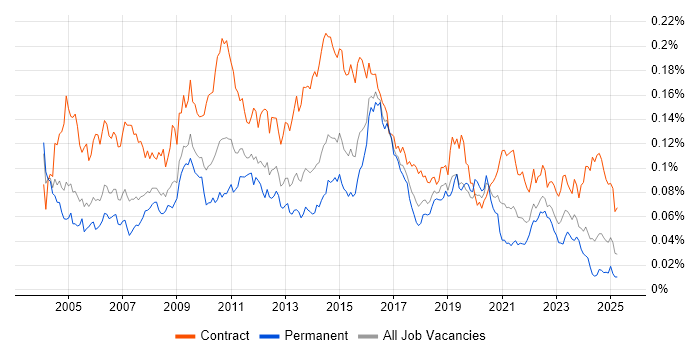
Job Vacancy Trend
Job postings citing Control-M as a proportion of all IT jobs advertised.

Control-M
Contractor Daily Rate Trend
3-month moving average daily rate quoted in jobs citing Control-M.
Control-M
Daily Rate Histogram
Daily rate distribution for jobs citing Control-M over the 6 months to 13 July 2025.
Control-M
Contractor Hourly Rate Trend
3-month moving average hourly rates quoted in jobs citing Control-M.
Control-M
Top 7 Contract Locations
The table below looks at the demand and provides a guide to the median contractor rates quoted in IT jobs citing Control-M within the UK over the 6 months to 13 July 2025. The 'Rank Change' column provides an indication of the change in demand within each location based on the same 6 month period last year.
| Location | Rank Change on Same Period Last Year |
Matching Contract IT Job Ads |
Median Daily Rate Past 6 Months |
Median Daily Rate % Change on Same Period Last Year |
Live Jobs |
|---|---|---|---|---|---|
| England | +21 | 25 | £650 | +35.06% | 16 |
| UK excluding London | +28 | 16 | £538 | +13.16% | 5 |
| London | +16 | 15 | £650 | +30.00% | 4 |
| North of England | +18 | 10 | £590 | +52.26% | 2 |
| Yorkshire | - | 10 | £590 | - | |
| Wales | - | 6 | £283 | - | |
| Work from Home | +26 | 5 | £725 | +52.63% |
Control-M
Co-occurring Skills and Capabilities by Category
The follow tables expand on the table above by listing co-occurrences grouped by category. The same employment type, locality and period is covered with up to 20 co-occurrences shown in each of the following categories:
|
|
||||||||||||||||||||||||||||||||||||||||||||||||||||||||||||||||||||||||||||||||||||||||||||||||
|
|
||||||||||||||||||||||||||||||||||||||||||||||||||||||||||||||||||||||||||||||||||||||||||||||||
|
|
||||||||||||||||||||||||||||||||||||||||||||||||||||||||||||||||||||||||||||||||||||||||||||||||
|
|
||||||||||||||||||||||||||||||||||||||||||||||||||||||||||||||||||||||||||||||||||||||||||||||||
|
|
||||||||||||||||||||||||||||||||||||||||||||||||||||||||||||||||||||||||||||||||||||||||||||||||
|
|
||||||||||||||||||||||||||||||||||||||||||||||||||||||||||||||||||||||||||||||||||||||||||||||||
|
|
||||||||||||||||||||||||||||||||||||||||||||||||||||||||||||||||||||||||||||||||||||||||||||||||
|
|
||||||||||||||||||||||||||||||||||||||||||||||||||||||||||||||||||||||||||||||||||||||||||||||||
|
|
||||||||||||||||||||||||||||||||||||||||||||||||||||||||||||||||||||||||||||||||||||||||||||||||
