Inclusion and Diversity Contracts with Hybrid/Remote/WFH Options

Inclusion and Diversity
UK > Work from Home

The table below looks at the prevalence of the term Inclusion and Diversity in remote or hybrid contract work. Included is a benchmarking guide to the contractor rates offered in vacancies that cited Inclusion and Diversity over the 6 months leading up to 3 May 2025, comparing them to the same period in the previous two years.

6 months to
3 May 2025
Same period 2024 Same period 2023
Rank 107 137 186
Rank change year-on-year +30 +49 +289
Contract jobs citing Inclusion and Diversity 243 242 339
As % of all contract jobs with a WFH option 2.46% 1.59% 1.32%
As % of the General category 3.94% 2.70% 2.26%
Number of daily rates quoted 128 175 208
10th Percentile £327 £405 £475
25th Percentile £413 £500 £531
Median daily rate (50th Percentile) £575 £600 £600
Median % change year-on-year -4.17% - +20.00%
75th Percentile £656 £656 £650
90th Percentile £725 £775 £733
UK median daily rate £533 £600 £600
% change year-on-year -11.25% - +9.09%
Number of hourly rates quoted 0 1 0
Median hourly rate - £12.54 -
UK median hourly rate £22.14 £21.99 £39.00
% change year-on-year +0.68% -43.62% -22.00%

All General Skills
Work from Home

Inclusion and Diversity falls under the General Skills category. For comparison with the information above, the following table provides summary statistics for all contract job vacancies with remote or hybrid options requiring common skills.

Contract vacancies with a requirement for common skills 6,169 8,972 15,008
As % of all contract jobs with a WFH option 62.33% 58.81% 58.47%
Number of daily rates quoted 4,160 5,871 10,584
10th Percentile £327 £330 £363
25th Percentile £417 £425 £450
Median daily rate (50th Percentile) £525 £535 £550
Median % change year-on-year -1.87% -2.73% +4.76%
75th Percentile £650 £650 £675
90th Percentile £800 £775 £775
UK median daily rate £525 £525 £550
% change year-on-year - -4.55% +2.33%
Number of hourly rates quoted 179 476 348
10th Percentile £14.00 £14.03 £19.04
25th Percentile £18.36 £22.61 £28.24
Median hourly rate £31.76 £38.12 £51.00
Median % change year-on-year -16.68% -25.25% +60.13%
75th Percentile £64.88 £53.00 £67.50
90th Percentile £86.00 £72.50 £80.08
UK median hourly rate £27.50 £30.00 £34.31
% change year-on-year -8.33% -12.56% +57.28%

Inclusion and Diversity
Trend for Jobs with a WFH Option

Job vacancies with remote working options citing Inclusion and Diversity as a proportion of all IT jobs advertised.
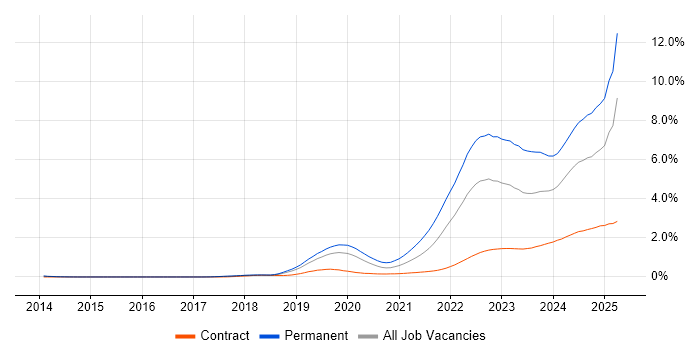
Inclusion and Diversity trend for jobs with Hybrid/Remote/WFH options

Inclusion and Diversity
Daily Rate Trend for Jobs with a WFH Option

3-month moving average daily rate quoted in job vacancies with remote working options citing Inclusion and Diversity.

Inclusion and Diversity daily rate for jobs with a WFH option

Inclusion and Diversity
Daily Rate Histogram for Jobs with a WFH Option

Daily rate distribution for jobs with remote working options citing Inclusion and Diversity over the 6 months to 3 May 2025.

Inclusion and Diversity daily rate histogram for jobs with a WFH option

Inclusion and Diversity
Hourly Rate Trend for Jobs with a WFH Option

3-month moving average hourly rate quoted in job vacancies with remote working options citing Inclusion and Diversity.

Inclusion and Diversity hourly rate for jobs with a WFH option

Inclusion and Diversity
Co-occurring Skills and Capabilities with WFH Options by Category

The follow tables expand on the table above by listing co-occurrences grouped by category. The same employment type, locality and period is covered with up to 20 co-occurrences shown in each of the following categories:

Application Platforms
1 10 (4.12%) SharePoint
2 8 (3.29%) Confluence
3 6 (2.47%) Apache Spark
3 6 (2.47%) CMS
4 3 (1.23%) IBM Notes
5 2 (0.82%) Apache
5 2 (0.82%) Drupal
5 2 (0.82%) Microsoft Exchange
5 2 (0.82%) Oracle SOA Suite
6 1 (0.41%) Apache Airflow
6 1 (0.41%) nginx
6 1 (0.41%) Traefik
Applications
1 14 (5.76%) Microsoft Excel
2 10 (4.12%) Microsoft Office
3 4 (1.65%) MS Visio
4 3 (1.23%) Microsoft Project
5 2 (0.82%) Microsoft PowerPoint
6 1 (0.41%) Revit
Business Applications
1 2 (0.82%) Aladdin
1 2 (0.82%) CiviCRM
1 2 (0.82%) Remedy ITSM
2 1 (0.41%) Oracle ERP
2 1 (0.41%) Primavera
Cloud Services
1 40 (16.46%) Azure
2 29 (11.93%) Power Platform
3 23 (9.47%) AWS
4 16 (6.58%) Entra ID
5 10 (4.12%) Microsoft 365
6 8 (3.29%) Azure DevOps
6 8 (3.29%) Snowflake
7 7 (2.88%) dbt
8 6 (2.47%) GCP
9 5 (2.06%) SaaS
10 4 (1.65%) Dynamics 365
10 4 (1.65%) Microsoft Purview
10 4 (1.65%) PowerApps
11 3 (1.23%) AWS CloudFormation
11 3 (1.23%) Power Automate
12 2 (0.82%) Azure Data Factory
12 2 (0.82%) Collibra
12 2 (0.82%) GitHub
12 2 (0.82%) Google Analytics
12 2 (0.82%) Slack
Communications & Networking
1 7 (2.88%) Firewall
2 6 (2.47%) Radio Access Network
3 5 (2.06%) Network Security
4 4 (1.65%) 4G
4 4 (1.65%) MPLS
5 3 (1.23%) 2G
5 3 (1.23%) 3G
5 3 (1.23%) 5G
5 3 (1.23%) BGP
5 3 (1.23%) DNS
5 3 (1.23%) Ethernet
5 3 (1.23%) VPN
5 3 (1.23%) WAN
6 2 (0.82%) DHCP
6 2 (0.82%) EIGRP
6 2 (0.82%) Internet
6 2 (0.82%) OSPF
6 2 (0.82%) SD-WAN
6 2 (0.82%) TCP/IP
6 2 (0.82%) Wi-Fi
Database & Business Intelligence
1 26 (10.70%) Power BI
2 8 (3.29%) Data Warehouse
3 7 (2.88%) Big Data
4 6 (2.47%) MongoDB
5 4 (1.65%) Hadoop
5 4 (1.65%) Oracle Database
5 4 (1.65%) Tableau
6 3 (1.23%) Azure SQL Database
6 3 (1.23%) NoSQL
6 3 (1.23%) PostgreSQL
6 3 (1.23%) SQL Server
7 2 (0.82%) Amazon Redshift
7 2 (0.82%) Apache Hive
7 2 (0.82%) BigQuery
7 2 (0.82%) BusinessObjects
7 2 (0.82%) Data Mining
7 2 (0.82%) HBase
7 2 (0.82%) Impala
7 2 (0.82%) Power Query
7 2 (0.82%) Relational Database
Development Applications
1 10 (4.12%) JIRA
2 7 (2.88%) Git
3 5 (2.06%) Cypress.io
3 5 (2.06%) Selenium
4 4 (1.65%) HP UFT
4 4 (1.65%) TestComplete
5 3 (1.23%) GitLab
5 3 (1.23%) Oracle Forms
6 2 (0.82%) CircleCI
7 1 (0.41%) Cucumber
7 1 (0.41%) Jasmine
7 1 (0.41%) Jenkins
7 1 (0.41%) JUnit
7 1 (0.41%) Mockito
General
1 69 (28.40%) Social Skills
2 58 (23.87%) Finance
3 40 (16.46%) Analytical Skills
4 24 (9.88%) Public Sector
5 12 (4.94%) Law
5 12 (4.94%) Telecoms
6 6 (2.47%) Legal
7 5 (2.06%) Automotive
7 5 (2.06%) Organisational Skills
7 5 (2.06%) Retail
8 4 (1.65%) Influencing Skills
8 4 (1.65%) Marketing
9 3 (1.23%) Banking
9 3 (1.23%) Pharmaceutical
10 2 (0.82%) Financial Institution
10 2 (0.82%) Manufacturing
10 2 (0.82%) Police
11 1 (0.41%) Documentation Skills
11 1 (0.41%) Presentation Skills
11 1 (0.41%) Spanish Language
Job Titles
1 65 (26.75%) Analyst
2 26 (10.70%) Business Analyst
2 26 (10.70%) Developer
3 21 (8.64%) Senior
4 17 (7.00%) Architect
5 15 (6.17%) Lead
6 13 (5.35%) Consultant
7 11 (4.53%) Data Analyst
8 9 (3.70%) Designer
9 7 (2.88%) Azure Architect
9 7 (2.88%) Project Manager
10 6 (2.47%) Service Analyst
10 6 (2.47%) Service Desk Analyst
10 6 (2.47%) Snowflake Developer
10 6 (2.47%) Test Analyst
11 5 (2.06%) 1st Line Support
11 5 (2.06%) IT Manager
11 5 (2.06%) Network Engineer
11 5 (2.06%) Senior DevOps
11 5 (2.06%) Technical Analyst
Libraries, Frameworks & Software Standards
1 8 (3.29%) .NET
2 5 (2.06%) Kafka
3 4 (1.65%) Akka
3 4 (1.65%) LDAP
3 4 (1.65%) Play Framework
3 4 (1.65%) Playwright
4 3 (1.23%) React
5 2 (0.82%) .NET Core
5 2 (0.82%) .NET Framework
5 2 (0.82%) Apache Avro
5 2 (0.82%) CSS
5 2 (0.82%) Entity Framework
5 2 (0.82%) HTML
5 2 (0.82%) JSON
5 2 (0.82%) LINQ
5 2 (0.82%) RESTful
6 1 (0.41%) Dagger
6 1 (0.41%) Keycloak
6 1 (0.41%) Next.js
6 1 (0.41%) XML
Miscellaneous
1 11 (4.53%) Management Information System
1 11 (4.53%) Product Ownership
2 10 (4.12%) Onboarding
3 9 (3.70%) Data Centre
4 6 (2.47%) Security Posture
4 6 (2.47%) Self-Motivation
5 5 (2.06%) Industry 4.0
5 5 (2.06%) IoT
6 4 (1.65%) Social Media
6 4 (1.65%) Team-Oriented Environment
7 3 (1.23%) Algorithms
7 3 (1.23%) Data Structures
7 3 (1.23%) Distributed Systems
7 3 (1.23%) Greenfield Project
8 2 (0.82%) Fixed Income
8 2 (0.82%) Linux Command Line
8 2 (0.82%) PMI
9 1 (0.41%) Analytical Mindset
9 1 (0.41%) Legacy Systems
9 1 (0.41%) NHS
Operating Systems
1 22 (9.05%) Windows
2 15 (6.17%) Linux
3 6 (2.47%) Unix
3 6 (2.47%) Windows Server
4 4 (1.65%) Amazon Linux
5 3 (1.23%) Mac OS
6 2 (0.82%) Red Hat Enterprise Linux
7 1 (0.41%) Android
7 1 (0.41%) CentOS
7 1 (0.41%) VMS
7 1 (0.41%) Windows Server 2019
Processes & Methodologies
1 46 (18.93%) Problem-Solving
2 44 (18.11%) Agile
3 26 (10.70%) Business Intelligence
4 23 (9.47%) Mentoring
5 22 (9.05%) Decision-Making
6 21 (8.64%) CI/CD
6 21 (8.64%) DevOps
6 21 (8.64%) Stakeholder Management
7 20 (8.23%) Migration
8 19 (7.82%) Continuous Improvement
9 18 (7.41%) Analytics
10 16 (6.58%) ITIL
10 16 (6.58%) Visualisation
11 15 (6.17%) Roadmaps
12 14 (5.76%) Artificial Intelligence
12 14 (5.76%) CRM
12 14 (5.76%) Project Management
12 14 (5.76%) Test Automation
13 13 (5.35%) Change Management
13 13 (5.35%) Data Analysis
Programming Languages
1 37 (15.23%) SQL
2 23 (9.47%) Python
3 10 (4.12%) JavaScript
4 9 (3.70%) Java
5 7 (2.88%) C#
6 5 (2.06%) PowerShell
7 4 (1.65%) R
7 4 (1.65%) Scala
8 3 (1.23%) Go
9 2 (0.82%) Bash
9 2 (0.82%) Kotlin
9 2 (0.82%) TypeScript
10 1 (0.41%) Data Analysis Expressions
10 1 (0.41%) VBA
Qualifications
1 35 (14.40%) Security Cleared
2 32 (13.17%) SC Cleared
3 25 (10.29%) Degree
4 8 (3.29%) Computer Science Degree
5 3 (1.23%) ACCA
5 3 (1.23%) CIMA
5 3 (1.23%) PMI Certification
5 3 (1.23%) PMP
6 2 (0.82%) APMP
6 2 (0.82%) DBS Check
6 2 (0.82%) Master's Degree
7 1 (0.41%) AWS Certification
7 1 (0.41%) BPSS Clearance
7 1 (0.41%) CAPM
7 1 (0.41%) CTC Cleared
7 1 (0.41%) DV Cleared
7 1 (0.41%) MAPM
7 1 (0.41%) MBA
7 1 (0.41%) PRINCE2 Practitioner
7 1 (0.41%) RIBA
Quality Assurance & Compliance
1 10 (4.12%) Data Quality
2 9 (3.70%) QA
3 6 (2.47%) Accessibility
3 6 (2.47%) SLA
4 5 (2.06%) ISO/IEC 27001
4 5 (2.06%) NIST
5 4 (1.65%) Actionable Recommendations
5 4 (1.65%) PMO
6 3 (1.23%) GDPR
7 2 (0.82%) NIST 800
7 2 (0.82%) P3O
8 1 (0.41%) COBIT
8 1 (0.41%) COSO
8 1 (0.41%) Government Security Classifications
8 1 (0.41%) GxP
8 1 (0.41%) HMG Security Policy Framework
8 1 (0.41%) IFRS
8 1 (0.41%) NCSC
8 1 (0.41%) PCI DSS
System Software
1 9 (3.70%) Active Directory
2 5 (2.06%) Docker
3 3 (1.23%) VMware Infrastructure
4 2 (0.82%) HDFS
Systems Management
1 6 (2.47%) Kubernetes
1 6 (2.47%) Microsoft Intune
1 6 (2.47%) Terraform
2 5 (2.06%) SCCM
3 4 (1.65%) Kibana
3 4 (1.65%) Single Sign-On
4 2 (0.82%) Ansible
4 2 (0.82%) Grafana
4 2 (0.82%) Prometheus
5 1 (0.41%) Consul
5 1 (0.41%) FortiGate
5 1 (0.41%) HAProxy
5 1 (0.41%) Istio
5 1 (0.41%) Jamf Pro
5 1 (0.41%) linkerd
5 1 (0.41%) Packer
5 1 (0.41%) Rancher
5 1 (0.41%) WSUS
5 1 (0.41%) ZABBIX
Vendors
1 26 (10.70%) Microsoft
2 9 (3.70%) Oracle
2 9 (3.70%) VMware
3 8 (3.29%) ServiceNow
4 6 (2.47%) CyberArk
5 5 (2.06%) Google
5 5 (2.06%) SAP
6 4 (1.65%) Apple
6 4 (1.65%) Bloomberg
6 4 (1.65%) BT
6 4 (1.65%) Cisco
6 4 (1.65%) Databricks
6 4 (1.65%) IFS
6 4 (1.65%) Murex
6 4 (1.65%) Red Hat
6 4 (1.65%) Reuters
7 3 (1.23%) Lotus
7 3 (1.23%) Salesforce
8 2 (0.82%) Blue Prism
8 2 (0.82%) Palo Alto